. 2005 Aug 2;102(31):10823-7.
doi: 10.1073/pnas.0501647102. Epub 2005 Jul 25.

Drier summers cancel out the CO2 uptake enhancement induced by warmer springs

Affiliations

Drier summers cancel out the CO2 uptake enhancement induced by warmer springs

A Angert et al. Proc Natl Acad Sci U S A. .

Abstract

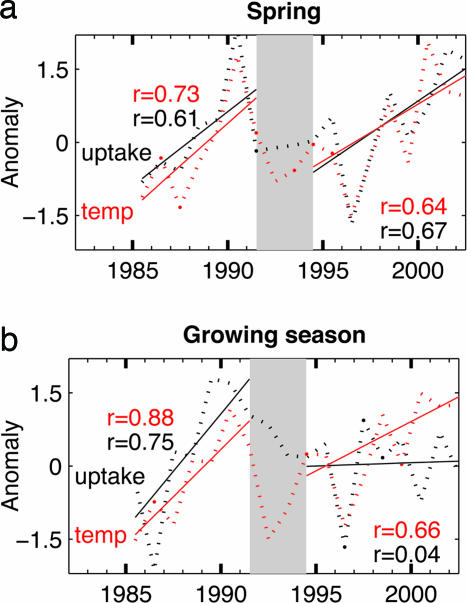
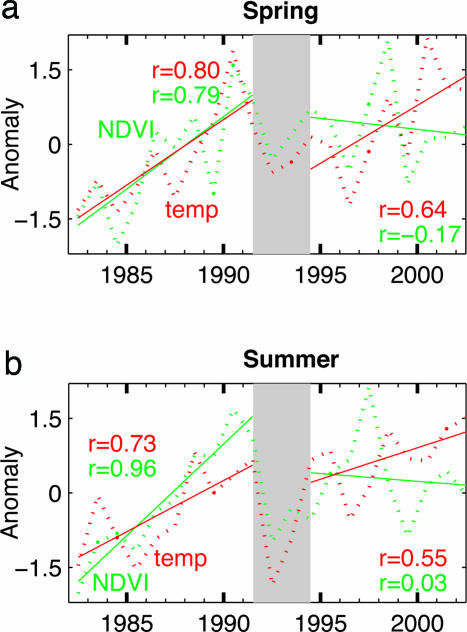
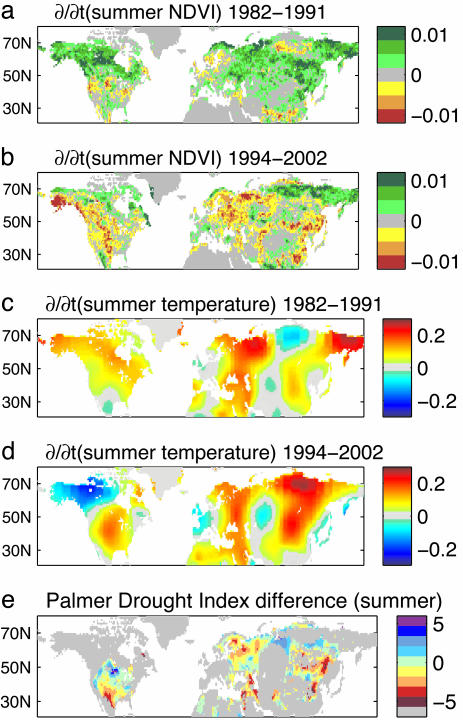
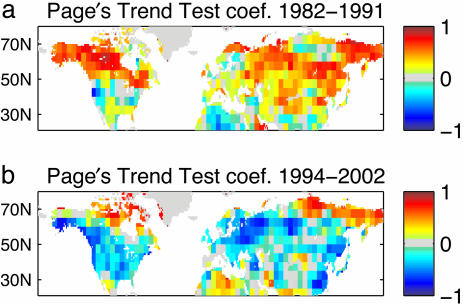
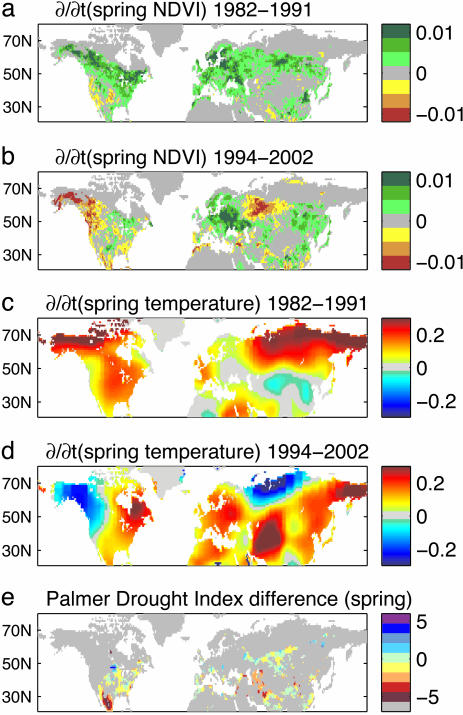
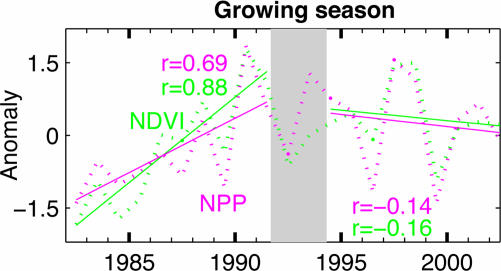
An increase in photosynthetic activity of the northern hemisphere terrestrial vegetation, as derived from satellite observations, has been reported in previous studies. The amplitude of the seasonal cycle of the annually detrended atmospheric CO(2) in the northern hemisphere (an indicator of biospheric activity) also increased during that period. We found, by analyzing the annually detrended CO(2) record by season, that early summer (June) CO(2) concentrations indeed decreased from 1985 to 1991, and they have continued to decrease from 1994 up to 2002. This decrease indicates accelerating springtime net CO(2) uptake. However, the CO(2) minimum concentration in late summer (an indicator of net growing-season uptake) showed no positive trend since 1994, indicating that lower net CO(2) uptake during summer cancelled out the enhanced uptake during spring. Using a recent satellite normalized difference vegetation index data set and climate data, we show that this lower summer uptake is probably the result of hotter and drier summers in both mid and high latitudes, demonstrating that a warming climate does not necessarily lead to higher CO(2) growing-season uptake, even in high-latitude ecosystems that are considered to be temperature limited.


Figures

Fig. 1.
Fig. 1.
Extratropic mean normalized anomalies in the net spring uptake [dotted black line, expressed by inverted early summer (June) detrended CO2 concentration] and spring (MAM) temperature (dotted red line, weighted by NPP) (a) and in the net growing-season uptake (dotted black line, expressed by inverted seasonal minimum detrended CO2 concentration taken from the GLOBALVIEW “reference marine boundary layer matrix”) and growing season (MAMJJA) temperature (dotted red line, weighted by NPP) (b). Regressions against time for the periods 1985–1991, and 1994–2002 are shown by solid lines, and r values, with corresponding color. The period 1992–1993, which was influenced by the Mount Pinatubo eruption, is marked in gray.
Fig. 2.
Fig. 2.
Extratropic mean normalized anomalies in the summer (JJA) NDVI (dotted green line) and the summer temperature (dotted red line, weighted by NPP) (a) and in the spring (MAM) NDVI (dotted green line) and the spring temperature (dotted red line, weighted by NPP) (b). Regressions against time for the periods 1982–1991 and 1994–2002 are shown by solid lines, and r values, with corresponding color. The period 1992–1993, which was influenced by the Mount Pinatubo eruption, is marked in gray.
Fig. 3.
Fig. 3.
Summer trends spatial distribution. Linear trends in summer (JJA) NDVI (a and b, in NDVI units per year) and summer surface temperatures (c and d,in°C/yr) for the periods 1982–1991 (a and c), and 1994–2002 (b and d). Gray indicates areas of no trend or persistent ice cover. A greening trend dominates the first period but is largely absent in the second. (e) The difference in the JJA Palmer Drought Index between the mean of 1994–2002 and the mean of 1982–1991, shown only for areas where a negative summer NDVI trend (<0) is accompanied by a warming trend (>0.05°C/yr). (Lower values indicate drier summers.)
Fig. 4.
Fig. 4.
Regression coefficients for the Page's trend test preformed on 3° × 3° (9 pixels) of mean summer NDVI for the periods 1982–1991 (a) and 1994–2002 (b). Significant positive values (red, indicating an increase in NDVI) dominate the first period, and negative values dominate the second period.
Fig. 5.
Fig. 5.
Spring trends spatial distribution. Linear trends in spring (MAM) NDVI (a and b, in NDVI units per year) and spring surface temperatures (c and d,in °C/yr), for the periods 1982–1991 (a and c), and 1994–2002 (b and d). Gray indicates areas of no trend or persistent ice cover. (e) The difference in the MAM Palmer Drought Index between the mean of 1994–2002 and the mean of 1982–1991, shown only for areas where a negative spring NDVI trend (<0) is accompanied by a warming trend (>0.05°C/yr). (Lower values indicate drier springs.)
Fig. 6.
Fig. 6.
Variations in the extratropic (20°N-90°N) growing-season (MAMJJA) NDVI (dotted green line) and CASA estimated NPP (dotted magenta line). Regressions against time for the periods 1982–1991 and 1994–2002 are shown by solid lines, and r values, with corresponding color. An increasing trend is evident in both NDVI and NPP in 1982–1991, followed by a decrease in 1992–1993 (influenced by the Mount Pinatubo eruption) and stalling of the trend from 1994 onward.

References

    1. Myneni, R. B., Keeling, C. D., Tucker, C. J., Asrar, G. & Nemani, R. R. (1997) Nature 386, 698-702.
    1. Zhou, L. M., Tucker, C. J., Kaufmann, R. K., Slayback, D., Shabanov, N. V. & Myneni, R. B. (2001) J. Geophys. Res. 106, 20069-20083.
    1. Slayback, D. A., Pinzon, J. E., Los, S. O. & Tucker, C. J. (2003) Global Change Biol. 9, 1-15.
    1. Tucker, C. J., Fung, I. Y., Keeling, C. D. & Gammon, R. H. (1986) Nature 319, 195-199.
    1. Nemani, R. R., Keeling, C. D., Hashimoto, H., Jolly, W. M., Piper, S. C., Tucker, C. J., Myneni, R. B. & Running, S. W. (2003) Science 300, 1560-1563. - PubMed

Publication types