Comparative Study
. 2005 Aug;126(2):105-21.
doi: 10.1085/jgp.200509286.

Probing the geometry of the inner vestibule of BK channels with sugars

Affiliations
Comparative Study

Probing the geometry of the inner vestibule of BK channels with sugars

Tinatin I Brelidze et al. J Gen Physiol. 2005 Aug.

Abstract

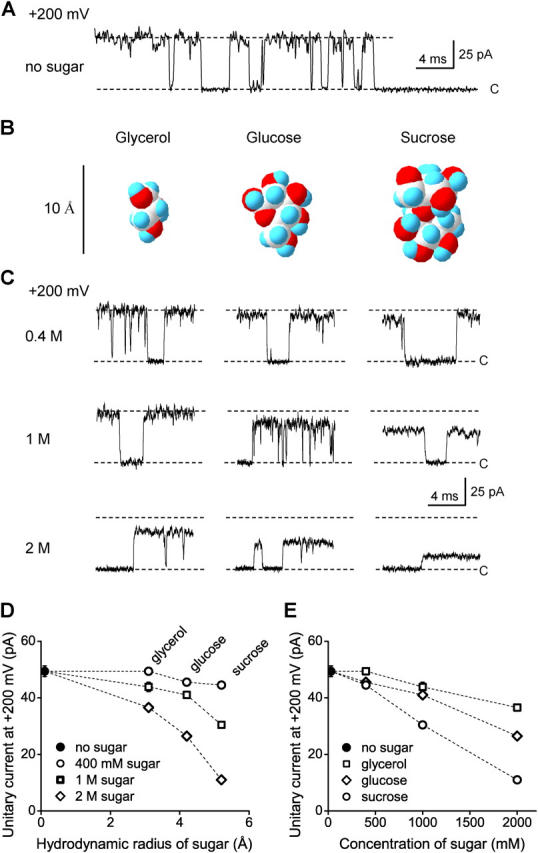
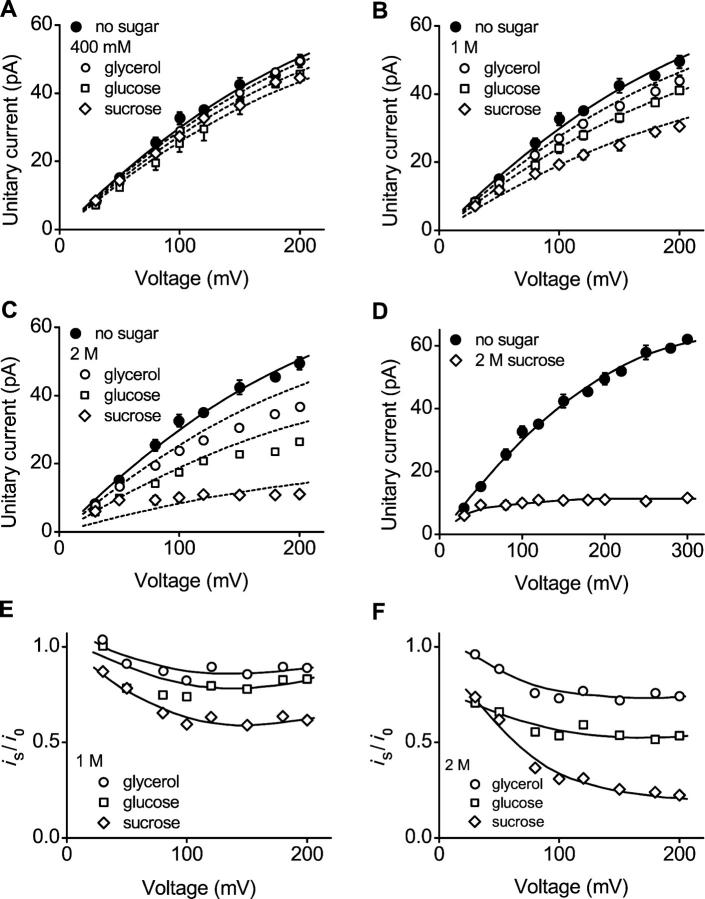
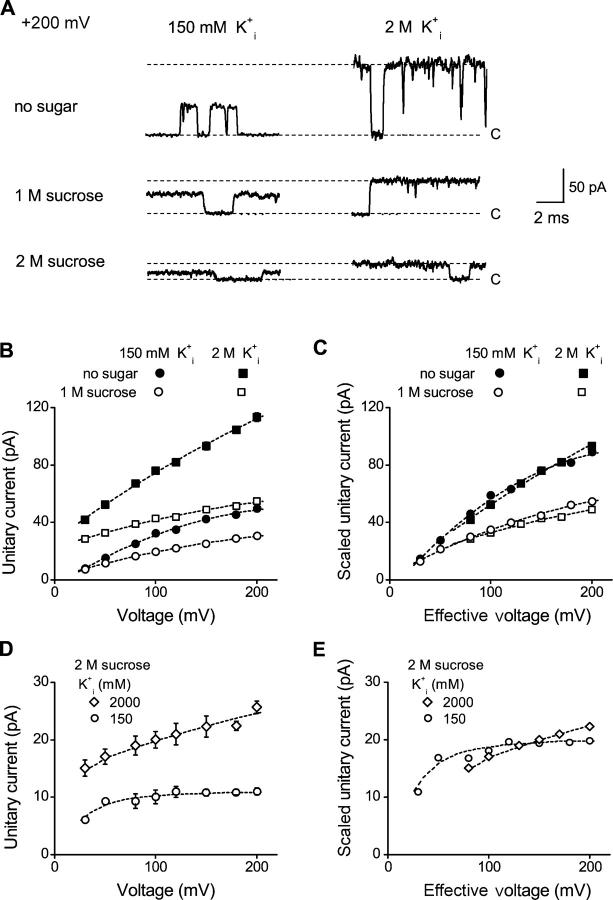
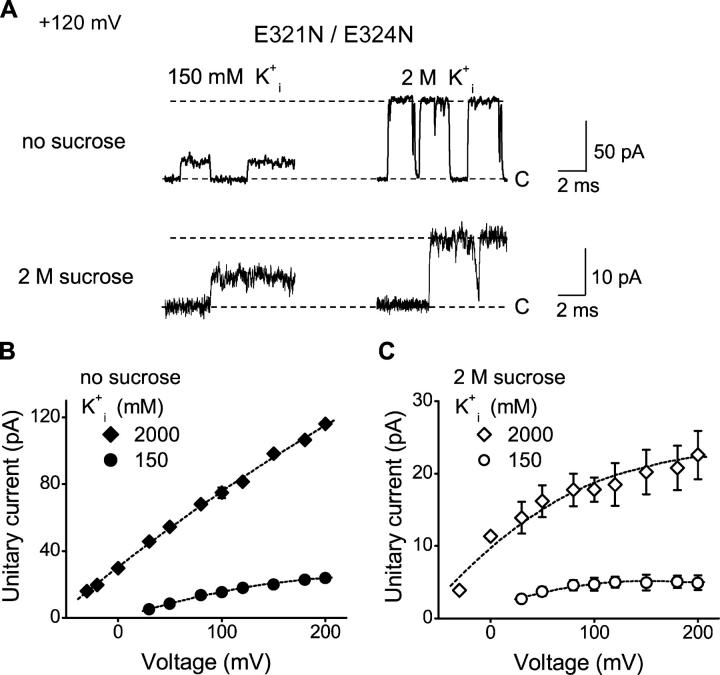
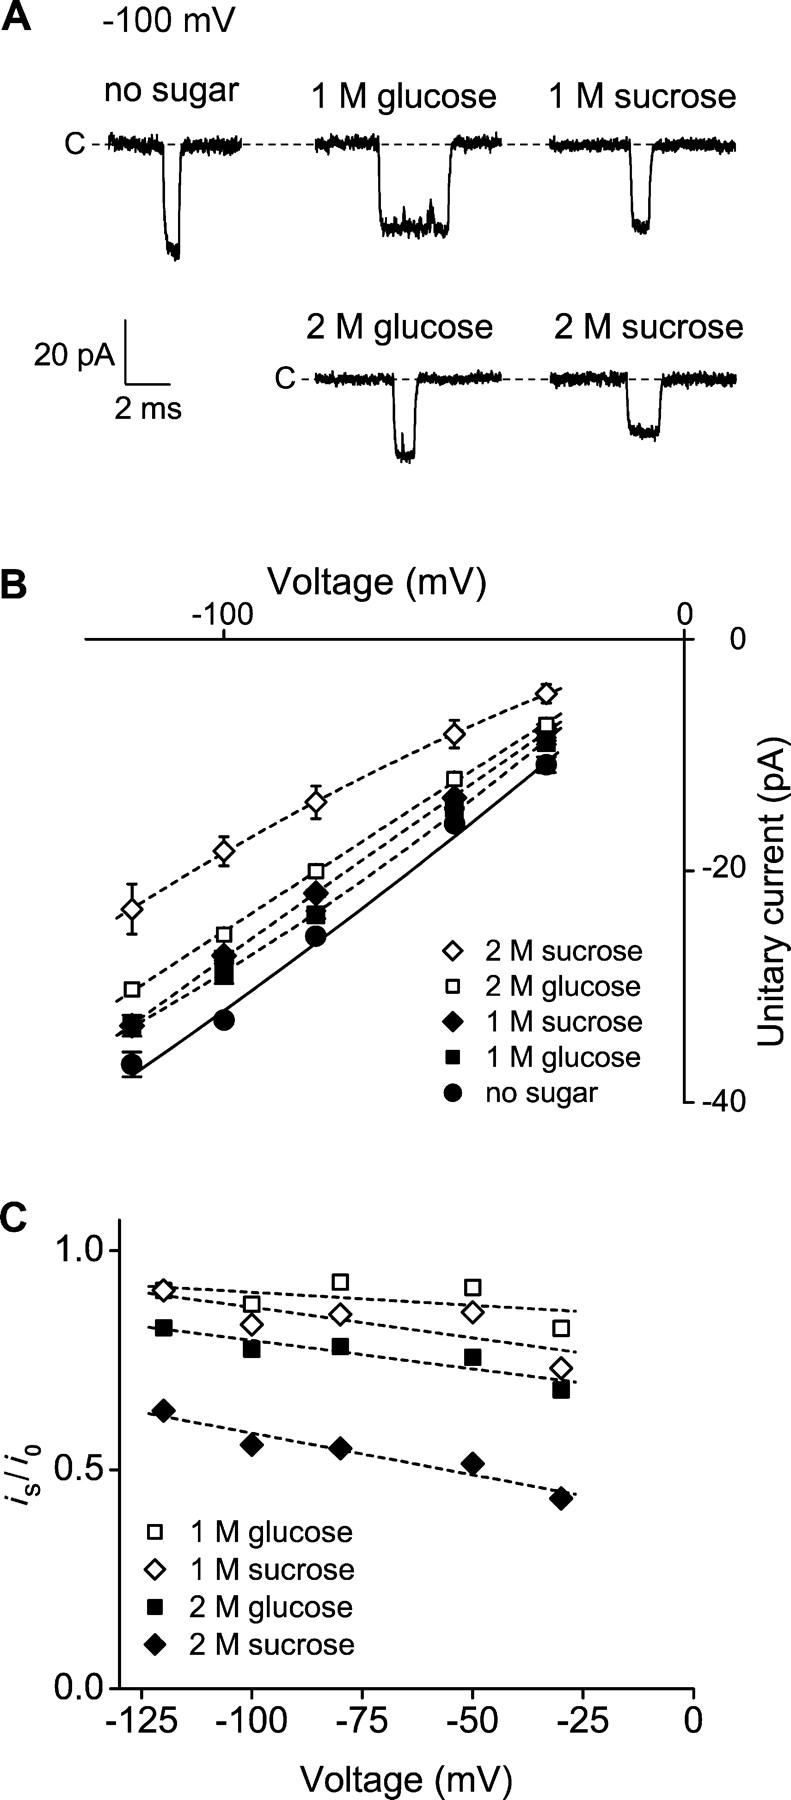
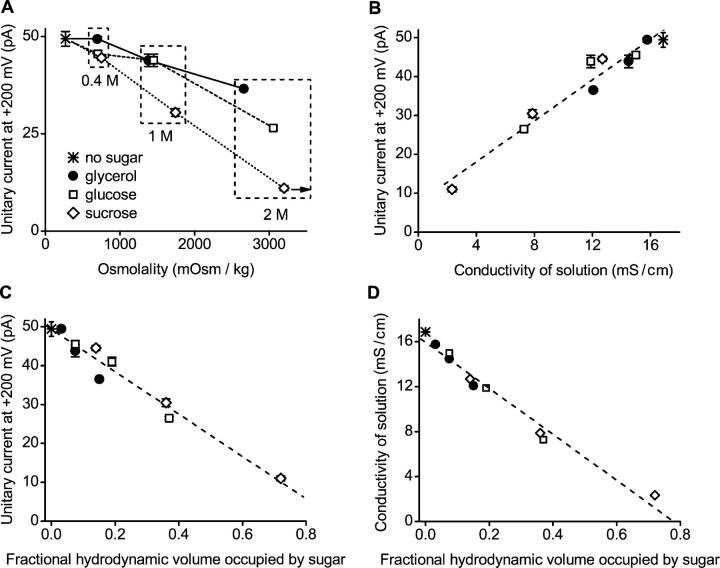
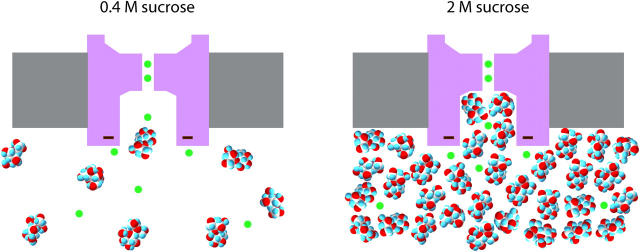
The geometry of the inner vestibule of BK channels was probed by examining the effects of different sugars in the intracellular solution on single-channel current amplitude (unitary current). Glycerol, glucose, and sucrose decreased unitary current through BK channels in a concentration- and size-dependent manner, in the order sucrose > glucose > glycerol, with outward currents being reduced more than inward currents. The fractional decrease of outward current was more directly related to the fractional hydrodynamic volume occupied by the sugars than to changes in osmolality. For concentrations of sugars < or =1 M, the i/V plots for outward currents in the presence and absence of sugar superimposed after scaling, and increasing K(+)(i) from 150 mM to 2 M increased the magnitudes of the i/V plots with little effect on the shape of the scaled curves. These observations suggest that sugars < or =1 M reduce outward currents mainly by entering the inner vestibule and reducing the movement of K(+) through the vestibule, rather than by limiting diffusion-controlled access of K(+) to the vestibule. With 2 M sucrose, the movement of K(+) into the inner vestibule became diffusion limited for 150 mM K(+)(i) and voltages > +100 mV. Increasing K(+)(i) then relieved the diffusion limitation. An estimate of the capture radius based on the 5 pA diffusion-limited current for channels without the ring of negative charge at the entrance to the inner vestibule was 2.2 A. Adding the radius of a hydrated K(+) (6-8 A) then gave an effective radius for the entrance to the inner vestibule of 8-10 A. Such a functionally wide entrance to the inner vestibule together with our observation that even small concentrations of sugar in the inner vestibule reduce unitary current suggest that a wide inner vestibule is required for the large conductance of BK channels.


Figures

Figure 1.
Figure 1.
Intracellular sugars decrease outward unitary currents through WT BK channels. (A) Representative outward single-channel currents recorded at +200 mV with no sugar in the intracellular solutions. Closed channel current level is indicated by C. Symmetrical 150 mM KCl and effective low pass filtering of 4 kHz in A and C. (B) Structures of the three sugar molecules used in this study shown as space filling surfaces. The images were obtained with Swiss Protein Viewer using atomic coordinates. The atomic coordinates for glycerol were from ChemFinder structural databases (http://chemfinder.cambridgesoft.com/), and for glucose and sucrose from the library of molecular structures at New York University (http://www.nyu.edu/pages/mathmol/library/library.html). The atoms are identified as: oxygen, red; carbon, white; and hydrogen, cyan. Scaling for the figure was based on dimensions determined from CPK models of the sugars (Harvard Apparatus). (C) Representative outward single-channel currents recorded at +200 mV with sugars in the intracellular solutions at the indicated concentrations. The type of sugar present in the solution for each column of currents in C is shown above the current records in B. (D) Plots of unitary current amplitudes at +200 mV versus the hydrodynamic radii of the different sugars over a range of concentrations, as indicated. The hydrodynamic radii were 3.1 Å, 4.2 Å, and 5.2 Å for glycerol, glucose, and sucrose, respectively, as determined by viscometry (Schultz and Solomon, 1961). (E) Plots of the unitary current amplitudes at +200 mV versus sugar concentration for the indicated sugars. The filled circles in D and E correspond to the unitary current amplitude at +200 mV in the absence of sugar.
Figure 2.
Figure 2.
Intracellular sugar decreases outward unitary currents through WT BK channels in a size- and concentration-dependent manner over the examined range of voltages. (A–D) Plots of outward unitary current amplitudes versus voltage without and with the indicated sugar. The continuous lines are polynomial fits to the unitary currents in the absence of sugar, whereas the dashed lines for each sugar are empirical predictions obtained by scaling the continuous lines by a single value obtained from Eq. 5, as listed in Table I in the predicted column. Symmetrical 150 mM KCl. (D) Unitary current amplitudes saturate with 2 M sucrose at voltages >+100 mV with 150 mM K+ i. (E and F) Outward currents drive sugar into the vestibule, decreasing the currents. Plots of the ratios of the outward unitary currents in the presence and absence of 1 M (E) and 2 M (F) sugar. The lines in D–F have no theoretical meaning.
Figure 3.
Figure 3.
Outward unitary currents are diffusion limited for WT BK channels with 2 M intracellular sucrose and 150 mM K+ i. (A) Representative outward unitary currents recorded at +200 mV from WT BK channels without and with 1 and 2 M sucrose, for 150 mM and 2 M K+ i. Effective filtering: 4 kHz. (B) Plots of outward unitary current amplitude versus voltage without and with 1 M sucrose at the indicated K+ i. (C) Currents with 1 M sucrose and 150 mM K+ i are not diffusion limited. The data in B are replotted after shifting the 2 M K+ i data to the right by 50 mV to correct for the shift in reversal potential and scaling the data by 1.8. The data points with 2 M K+ i for shifted voltages >200 mV are not shown. (D and E) Increasing K+ i removes the saturation of outward current at high voltage with 2 M sucrose, consistent with diffusion-limited currents in 2 M sucrose with 150 mM K+ i. The unitary currents with 2 M sucrose and with 150 mM K+ i or 2 M K+ i are plotted in D. The data in D are then replotted in E after shifting and scaling the data in the same manner as for C. The lines in B–D have no theoretical meaning.
Figure 4.
Figure 4.
Outward unitary currents with 2 M intracellular sucrose and 150 mM K+ i are diffusion limited for mutant BK channels without the ring of negative charge. (A) Representative outward single-channel currents recorded at +120 mV from E321N/E324 mutant channels with the indicated K+ i in the absence and presence of 2 M sucrose. Effective filtering: 4 kHz. (B and C) Plots of outward unitary current amplitudes versus voltage for E321N/E324N mutant channels in the absence (B) and presence (C) of 2 M sucrose at the indicated K+ i. High K+ i removes the saturation observed with 2 M sucrose. The lines in B and C have no theoretical meaning.
Figure 5.
Figure 5.
Sugars differentially decrease inward and outward unitary currents in WT BK channels. (A) Representative inward single-channel currents recorded at −100 mV from WT BK channels with and without the indicated sugars. Effective filtering: 4 kHz. (B) Plots of inward unitary current amplitudes versus voltage with and without the indicated sugars. (C) Inward currents drive sugar out of the vestibule. Plots of the ratios of the inward unitary currents in the presence of the indicated sugars (i s) to the inward unitary currents in the absence of sugars (i 0) versus voltage. Symmetrical 150 mM K+ i. The lines in B and C have no theoretical meaning.
Figure 6.
Figure 6.
The reduction of outward unitary currents in WT BK channels is strongly correlated with sugar-induced changes in diffusion coefficient, conductivity, and fractional hydrodynamic volume occupied by the sugar, but not osmolality. (A–C) Plots of the outward unitary current at +200 mV versus osmolality (A), conductivity (B), and fractional hydrodynamic volume of the solution occupied by sugar (C). The arrow in A indicates that the osmolality of the solution with 2 M sucrose was greater than the plotted maximum value that the osmometer could read. (D) Plot of conductivity versus fractional hydrodynamic volume. Dashed lines in B, C, and D are linear regression fits to the all the plotted points, with correlation coefficients, R, of 0.97, −0.98, and −0.99 respectively. For B, C, and D, the data for each sugar are presented for concentrations of 0.4, 1, and 2 M. As the concentration of each sugar increases, the conductivity of the solution decreases and the fractional hydrodynamic volume occupied by each sugar increases.
Figure 7.
Figure 7.
Cartoon of a BK channel with 150 mM K+ and 0.4 and 2 M sucrose. The inner vestibule is drawn with a depth of 20 Å and a diameter of 18.5 Å. The actual physical dimensions and shape are likely to be different. The number of ions visible is the average number that would be contained in an 8-Å slice in the plane of the figure centered on the centerline of the channel. It is assumed that the concentration of sucrose in the channel is the same as in the bulk intracellular solution. The negative charge at the entrance to the inner vestibule attracts additional K+ ions (Brelidze et al., 2003). The selectivity filter is drawn with two K+ ions (Morais-Cabral et al., 2001), and the pore helices are likely to provide a favorable electrostatic environment for a K+ ion in the vestibule (Roux and MacKinnon, 1999).

References

    1. Alcayaga, C., X. Cecchi, O. Alvarez, and R. Latorre. 1989. Streaming potential measurements in Ca2+-activated K+ channels from skeletal and smooth muscle. Coupling of ion and water fluxes. Biophys. J. 55:367–371. - PMC - PubMed
    1. Andersen, O.S. 1983. a. Ion movement through gramicidin A channels. Single-channel measurements at very high potentials. Biophys. J. 41:119–133. - PMC - PubMed
    1. Andersen, O.S. 1983. b. Ion movement through gramicidin A channels. Studies on the diffusion-controlled association step. Biophys. J. 41:147–165. - PMC - PubMed
    1. Arakawa, T., and S.N. Timasheff. 1982. Stabilization of protein structure by sugars. Biochemistry. 21:6536–6544. - PubMed
    1. Armstrong, C.M. 1971. Interaction of tetraethylammonium ion derivatives with the potassium channels of giant axons. J. Gen. Physiol. 58:413–437. - PMC - PubMed

Publication types