

Contrast response properties of magnocellular and parvocellular pathways in retinitis pigmentosa assessed by the visual evoked potential
- PMID: 16043873
- PMCID: PMC1283742
- DOI: 10.1167/iovs.05-0231
Contrast response properties of magnocellular and parvocellular pathways in retinitis pigmentosa assessed by the visual evoked potential
Abstract
Purpose: To evaluate the contrast response of the visual system in retinitis pigmentosa (RP) under conditions designed to emphasize the parvocellular (PC) and magnocellular (MC) pathways.
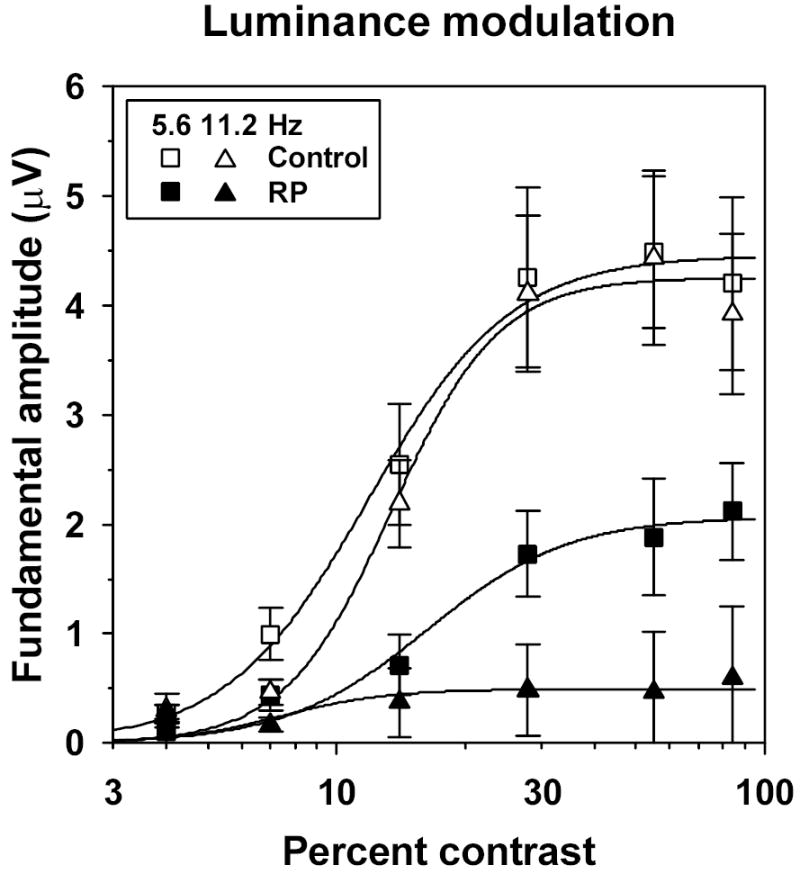
Method: Visual evoked potentials (VEPs) were measured in 10 patients with RP and in 10 age-equivalent control subjects with normal visual acuity and color vision, by using an array of isolated checks that were presented against a steady yellow background. The checks were modulated sinusoidally, either in isoluminant chromatic contrast (5.6 Hz), to favor the chromatic PC pathway, or in luminance contrast (5.6 and 11.2 Hz), to favor the MC pathway. Response amplitude and phase at the stimulus (fundamental) frequency were derived from Fourier analysis, and contrast response functions were fit with a Michaelis-Menten equation to derive R(max), the maximum response amplitude, and sigma, the contrast necessary to produce R(max)/2.
Results: In the control subjects, the mean amplitude function for chromatic modulation increased approximately linearly with increasing contrast, whereas the function for luminance modulation increased sharply at low contrasts and saturated at contrasts above approximately 30% for both temporal frequencies, as expected. The patients with RP showed primarily a reduction in R(max) with little change in sigma in all testing conditions. The reduction in R(max) was equivalent for chromatic modulation and luminance modulation at 5.6 Hz, but was substantially lower for luminance modulation at 11.2 Hz.
Conclusion: Contrast processing was impaired within both the MC and PC pathways in these patients with RP, but the degree of impairment within the MC pathway depended on temporal frequency. These VEP results are in general agreement with recent psychophysical studies of contrast sensitivity losses in patients with RP, and further they characterize contrast processing deficits in these patients at suprathreshold levels.
Figures


References
-
- Rivolta C, Sharon D, DeAngelis MM, Dryja TP. Retinitis pigmentosa and allied diseases: numerous diseases, genes, and inheritance patterns. Hum Mol Gen. 2002;11:1219–1227. - PubMed
-
- Flannery JG, Farber DB, Bird AC, Bok D. Degenerative changes in a retina affected with autosomal dominant retinitis pigmentosa. Invest Ophthalmol Vis Sci. 1989;30:191–211. - PubMed
-
- Stone JL, Barlow WE, Humayun MS, de Juan E, Milam AH. Morphometric analysis of macular photoreceptors and ganglion cells in retinas with retinitis pigmentosa. Arch Ophthalmol. 1992;110:1634–1639. - PubMed
-
- Santos A, Humayun MS, de Juan EJ, et al. Preservation of the inner retina in retinitis pigmentosa. A morphometric analysis. Arch Ophthalmol. 1997;115:511–515. - PubMed
-
- Grover S, Fishman GA, Alexander KR, Anderson RJ, Derlacki DJ. Visual acuity impairment in patients with retinitis pigmentosa. Ophthalmology. 1996;103:1593–1600. - PubMed
Publication types
MeSH terms
Grants and funding
LinkOut - more resources
Full Text Sources
