. 2005 Nov 1;106(9):3183-90.
doi: 10.1182/blood-2005-04-1399. Epub 2005 Jul 26.

Diffuse large B-cell lymphoma subgroups have distinct genetic profiles that influence tumor biology and improve gene-expression-based survival prediction

Affiliations

Diffuse large B-cell lymphoma subgroups have distinct genetic profiles that influence tumor biology and improve gene-expression-based survival prediction

Silvia Bea et al. Blood. .

Abstract

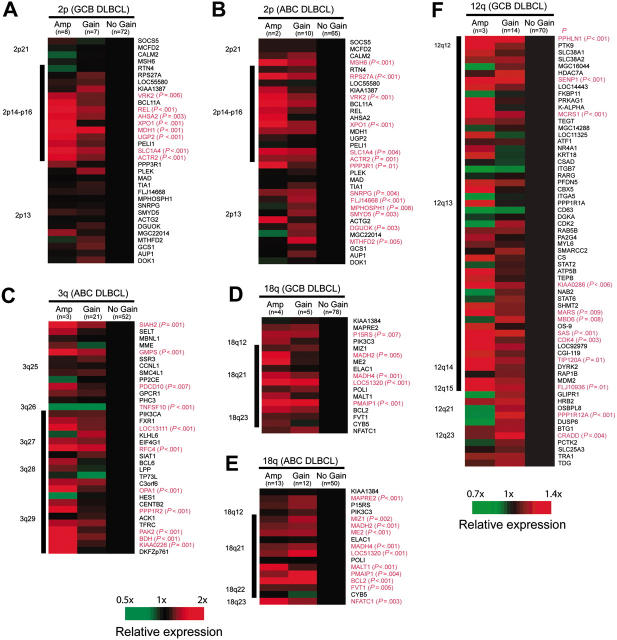
Gene-expression profiling has identified 3 major subgroups of diffuse large B-cell lymphoma (DLBCL): germinal center B-cell-like (GCB), activated B-cell-like (ABC), and primary mediastinal DLBCL (PMBCL). Using comparative genomic hybridization (CGH), we investigated the genetic alterations of 224 cases of untreated DLBCL (87 GCB-DLBCL, 77 ABC-DLBCL, 19 PMBCL, and 41 unclassified DLBCL) previously characterized by gene-expression profiling. The DLBCL subgroups differed significantly in the frequency of particular chromosomal aberrations. ABC-DLBCL had frequent trisomy 3, gains of 3q and 18q21-q22, and losses of 6q21-q22, whereas GCB-DLBCL had frequent gains of 12q12, and PMBCL had gains of 9p21-pter and 2p14-p16. Parallel analysis of CGH alterations, locus-specific gene-expression profiles, and global gene-expression signatures revealed that DNA amplifications and gains had a substantial impact on the expression of genes in the involved chromosomal regions, and some genes were overexpressed in a DLBCL subgroup-specific fashion. Unexpectedly, specific chromosomal alterations were associated with significant changes in gene-expression signatures that reflect various aspects of lymphoma cell biology as well as the host response to the lymphoma. In addition, gains involving the chromosomal region 3p11-p12 provided prognostic information that was statistically independent of the previously defined gene-expression-based survival model, thereby improving its predictive power.


Figures

Figure 1.
Figure 1.
Summary of chromosomal imbalances detected in 224 cases of untreated de novo DLBCL classified by gene-expression profiling. Red bars on the left side of the ideogram indicate losses of chromosomal material; green bars on the right side indicate gains of chromosomal material; thick green bars indicate chromosomal gains exceeding the cut-off value of 1.5 in a large chromosomal region; solid dots indicate high-level DNA amplifications. Each bar represents a chromosomal region gained or lost in a single sample. (A) GCB-DLBCL (n = 87); (B) ABC-DLBCL (n = 77); (C) PMBCL (n = 19); and (D) bar diagram indicating the frequencies of chromosomal imbalances that distinguish between ABC-DLBCL, GCB-DLBCL, and PMBCL (for statistical details see “Patients, materials, and methods”). All differences were statistically significant at P < .05, with the exception of 12q12 gains (P = .059).
Figure 2.
Figure 2.
Influence of chromosomal gains and amplifications on locus-specific gene-expression levels. Changes in gene-expression levels are depicted for each gene (averaged in each cohort) with regard to the locus-specific genetic status (wild-type vs gain vs amplification). Genes are ordered according to their chromosomal position shown on the right. Gene-locus information was obtained from the website for Genes On Sequence Map (Homo sapiens built 33). For genes with more than one microarray element on the Lymphochip, the average expression from different clones was calculated. The black bar on the left indicates the minimally gained region in all cases. The comparison of the expression levels was performed using the ANOVA test. Genes with significant differences (P < .01) are highlighted in red.
Figure 3.
Figure 3.
Chromosomal imbalances influence the lymph node, proliferation, T-cell, and MHC class II gene-expression signatures. In each of the 4 panels, DLBCL cases are ordered according to their average expression of the respective signature genes (the case with the lowest expression appears on the left end of the spectrum). Cases with the chromosomal abnormalities shown on the right are marked with a yellow bar. Correlations with a P value less than .05 are shown. If more than one cytoband in one chromosomal arm showed a P value less than .05, the cytoband with the lowest P value is displayed.
Figure 4.
Figure 4.
Impact of genomic gains of 3p11-p12 on survival of patients with DLBCL. Kaplan-Meier survival estimates of patients with DLBCL with genomic gains of 3p11-p12 in comparison to their stratification into survival quartiles based on the gene-expression-based outcome predictor model alone (P = .029). Q indicates quartile.

References

    1. The Non-Hodgkin's Lymphoma Classification Project. A clinical evaluation of the International Lymphoma Study Group classification of non-Hodgkin's lymphoma. Blood. 1997;89: 3909-3918. - PubMed
    1. Alizadeh AA, Eisen MB, Davis RE, et al. Distinct types of diffuse large B-cell lymphoma identified by gene expression profiling. Nature. 2000;403: 503-511. - PubMed
    1. Rosenwald A, Wright G, Chan WC, et al. The use of molecular profiling to predict survival after chemotherapy for diffuse large-B-cell lymphoma. N Engl J Med. 2002;346: 1937-1947. - PubMed
    1. Rosenwald A, Wright G, Leroy K, et al. Molecular diagnosis of primary mediastinal B cell lymphoma identifies a clinically favorable subgroup of diffuse large B cell lymphoma related to Hodgkin lymphoma. J Exp Med. 2003;198: 851-862. - PMC - PubMed
    1. Savage KJ, Monti S, Kutok JL, et al. The molecular signature of mediastinal large B-cell lymphoma differs from that of other diffuse large B-cell lymphomas and shares features with classical Hodgkin lymphoma. Blood. 2003;102: 3871-3879. - PubMed

Publication types

MeSH terms