Review
. 2005 Jul 29;360(1459):1411-25.
doi: 10.1098/rstb.2005.1667.

Theoretical models of selection and mutation on quantitative traits

Affiliations
Review

Theoretical models of selection and mutation on quantitative traits

Toby Johnson et al. Philos Trans R Soc Lond B Biol Sci. .

Abstract

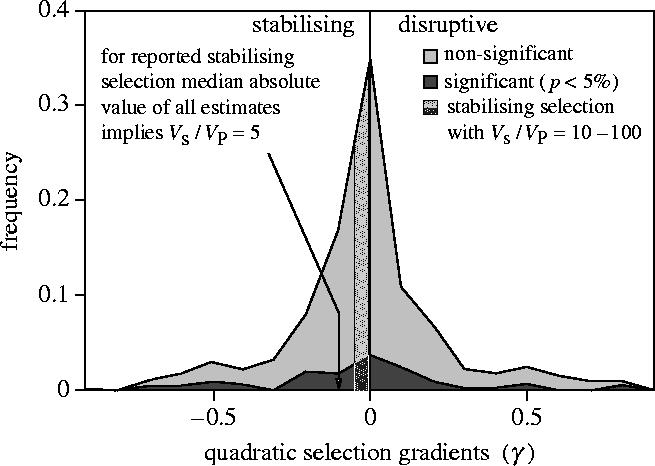
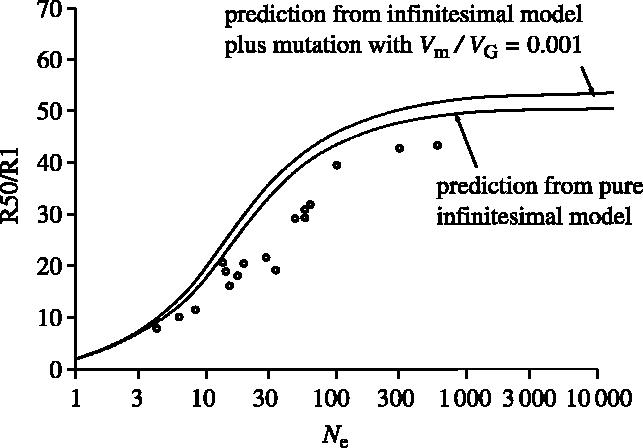
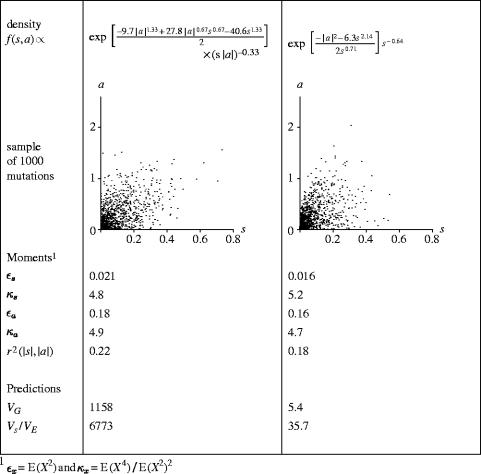
Empirical studies of quantitative genetic variation have revealed robust patterns that are observed both across traits and across species. However, these patterns have no compelling explanation, and some of the observations even appear to be mutually incompatible. We review and extend a major class of theoretical models, 'mutation-selection models', that have been proposed to explain quantitative genetic variation. We also briefly review an alternative class of 'balancing selection models'. We consider to what extent the models are compatible with the general observations, and argue that a key issue is understanding and modelling pleiotropy. We discuss some of the thorny issues that arise when formulating models that describe many traits simultaneously.


Figures

Figure 1
Figure 1
Strength of stabilizing selection used in theoretical work (e.g. Lande 1975; Turelli 1984) compared with estimated values (redrawn from Kingsolver et al. 2001), assuming ‘nor-optimal’ or Gaussian selection so that Vs/VP=1/2γ.
Figure 2
Figure 2
A survey of 10 artificial selection experiments, redrawn from Weber & Diggins (1990). Total response over 50 generations (R50), normalized by response in the first generation (R1) is plotted against effective population size during artificial selection. Over this time-scale, a simple model that explains the decline as a result of loss of VA owing to drift (solid lines) fits the data quite well.
Figure 3
Figure 3
Two modelling distributions that could be used in the pure pleiotropy model. The distributions look similar and have similar observable moment-based summaries, but model predictions (VG and Vs/VE, from appendix A and assuming h2=0.2) are sensitive to behaviour of the density near s=0, which given a rich enough class of modelling distributions is decoupled from the moments of the whole distribution.

References

    1. Aquadro C.F, Dene S.F, Bland M.M, Langley C.H, Laurie-Ahlberg C.C. Molecular population genetics of the alcohol dehydrogenase region of Drosophila melanogaster. Genetics. 1986;114:1165–1190. - PMC - PubMed
    1. Barton N.H. The maintenance of polygenic variation through a balance between mutation and stabilising selection. Genet. Res. 1986;54:59–77. - PubMed
    1. Barton N.H. Pleiotropic models of quantitative variation. Genetics. 1990;124:777–782. - PMC - PubMed
    1. Barton N.H. Clines in polygenic traits. Genet. Res. 1999;74:223–236. - PubMed
    1. Barton N.H, Keightley P.D. Understanding quantitative genetic variation. Nat. Rev. Genet. 2002;3:11–21. - PubMed

Publication types

LinkOut - more resources