. 2005 Aug 16;102(33):11594-9.
doi: 10.1073/pnas.0502575102. Epub 2005 Jul 27.

Emergent patterns of growth controlled by multicellular form and mechanics

Affiliations

Emergent patterns of growth controlled by multicellular form and mechanics

Celeste M Nelson et al. Proc Natl Acad Sci U S A. .

Abstract

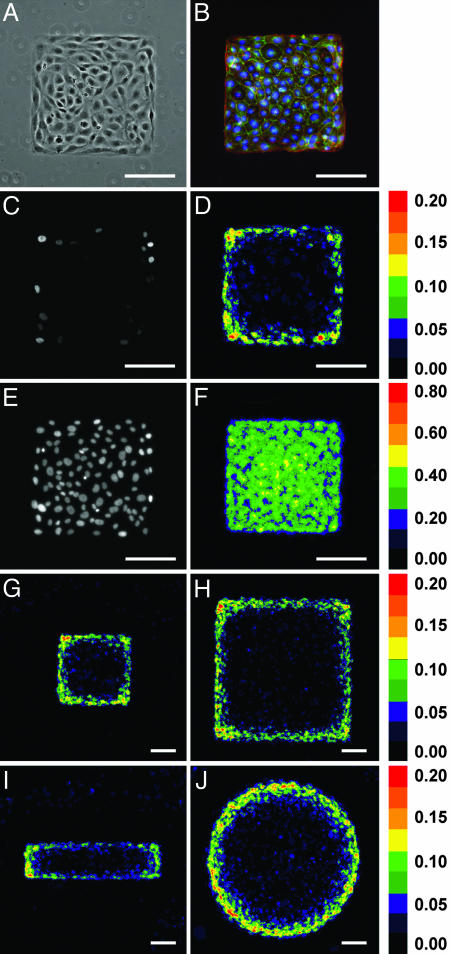
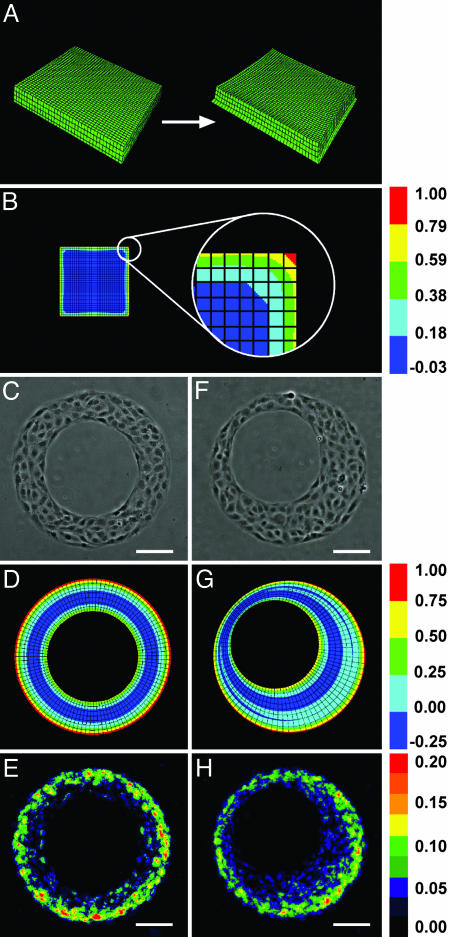
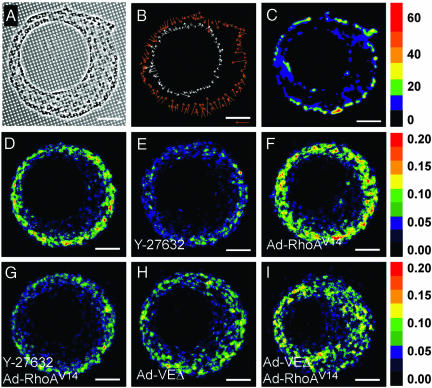
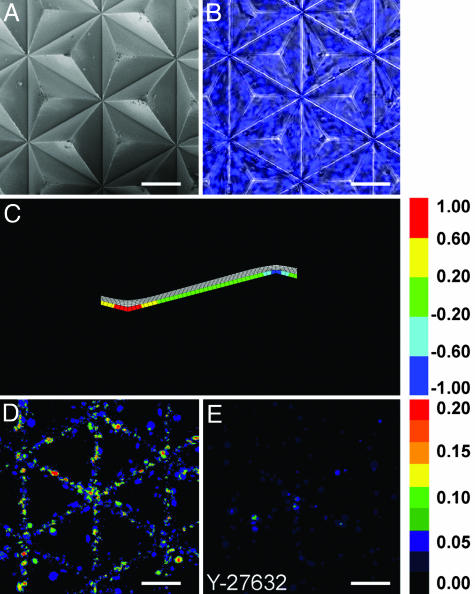
Spatial patterns of cellular growth generate mechanical stresses that help to push, fold, expand, and deform tissues into their specific forms. Genetic factors are thought to specify patterns of growth and other behaviors to drive morphogenesis. Here, we show that tissue form itself can feed back to regulate patterns of proliferation. Using micro-fabrication to control the organization of sheets of cells, we demonstrated the emergence of stable patterns of proliferative foci. Regions of concentrated growth corresponded to regions of high tractional stress generated within the sheet, as predicted by a finite-element model of multicellular mechanics and measured directly by using a micromechanical force sensor array. Inhibiting actomyosin-based tension or cadherin-mediated connections between cells disrupted the spatial pattern of proliferation. These findings demonstrate the existence of patterns of mechanical forces that originate from the contraction of cells, emerge from their multicellular organization, and result in patterns of growth. Thus, tissue form is not only a consequence but also an active regulator of tissue growth.


Figures

Fig. 1.
Fig. 1.
Method for detecting spatial variations in proliferation in sheets of cells. (A) Phase contrast image of cells on a small (250-μm edge) square island. (B) Fluorescence image of monolayer showing actin (red), VE-cadherin (green), and nuclei (blue). (C) Fluorescence image of cell proliferation (BrdUrd incorporation) in one island of cells. (D) Colorimetric stacked image of cell proliferation. A pixel value of 0.20 indicates that 20% of cells at that location proliferated. (E) Fluorescence image of all nuclei (stained with DAPI) in one island of cells. (F) Colorimetric stacked image of all nuclei showing a uniform distribution of cells in the monolayers. The pattern of proliferation is defined by the geometry of the island of cells. (GJ) Colorimetric stacked images of cell proliferation in small (250-μm edge) square (G), large (500-μm edge) square (H), small (125 × 500 μm) rectangular (I), and large (564-μm diameter) circular (J) islands. Statistical analysis is presented in Fig. 5. (Scale bars, 100 μm.)
Fig. 2.
Fig. 2.
The pattern of proliferation corresponds to predicted local mechanical stresses. (A) FEM mesh of contracting monolayer. (B) FEM calculations of relative maximum principal tractional stress exerted by cells in a small square island. (CE) Cells cultured on annulus. Shown are phase contrast (C), FEM results (D), and colorimetric stacked image of cell proliferation (E). (FH) Cells cultured on asymmetric annulus. Shown are phase contrast (F), FEM results (G), and colorimetric stacked image of cell proliferation (H). Outer diameter is 346 μm; inner diameter is 200 μm; center of asymmetric hole is 30 μm from the center of the island. Statistical analysis is presented in Fig. 5. (Scale bars, 100 μm.)
Fig. 3.
Fig. 3.
Mechanical forces generated by cytoskeletal contraction cause the patterns of proliferation. (AC) Cells cultured on elastomeric force sensor array. Shown are phase contrast image (A), vector map of traction forces measured at edges (B), and colorimetric map of traction forces measured over the entire monolayer (nN) (C). (DI) Colorimetric images of cell proliferation for cells cultured on asymmetric annulus and left untreated (D), treated with Y-27632 (E), infected with Ad-RhoAV14 (F), simultaneously treated with Y-27632 and infected with Ad-RhoAV14 (G), infected with Ad-VEΔ (H), or coinfected with Ad-VEΔ and Ad-RhoAV14 (I). Reference arrow in B indicates 50 nN of force. Statistical analysis is presented in Fig. 5. (Scale bars, 100 μm.)
Fig. 4.
Fig. 4.
Patterned proliferation corresponds to mechanical stresses in cellular aggregates that lack edges. (AE) Monolayer of cells on pyramidal array. Shown are scanning electron microscopy of substratum surface (A), phase contrast merged with fluorescence image of nuclei (B), FEM results (C), colorimetric stacked image of cell proliferation (D), and colorimetric image of cell proliferation when treated with Y-27632 (E). Tetrahedrons are pointed upward. Statistical analysis is presented in Fig. 5. (Scale bars, 100 μm.)

Comment in

References

    1. Thompson, D. A. W. (1917) On Growth and Form (Cambridge Univ. Press, Cambridge, U.K.).
    1. Salazar-Ciudad, I., Jernvall, J. & Newman, S. A. (2003) Development (Cambridge, U.K.) 130, 2027–2037. - PubMed
    1. Steinberg, M. S. (1962) Science 137, 762–763. - PubMed
    1. Keller, R. E. (1980) J. Embryol. Exp. Morphol. 60, 201–234. - PubMed
    1. Schoenwolf, G. C. & Franks, M. V. (1984) Dev. Biol. 105, 257–272. - PubMed

Publication types