

Mutation of Gly-94 in transmembrane segment M1 of Na+,K+-ATPase interferes with Na+ and K+ binding in E2P conformation
- PMID: 16049100
- PMCID: PMC1183542
- DOI: 10.1073/pnas.0501201102
Mutation of Gly-94 in transmembrane segment M1 of Na+,K+-ATPase interferes with Na+ and K+ binding in E2P conformation
Abstract
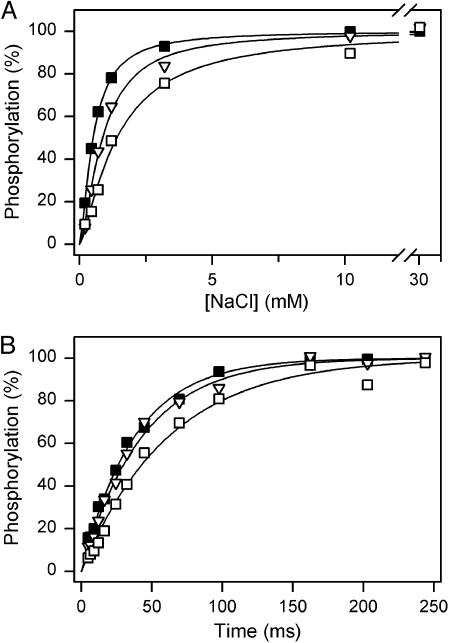
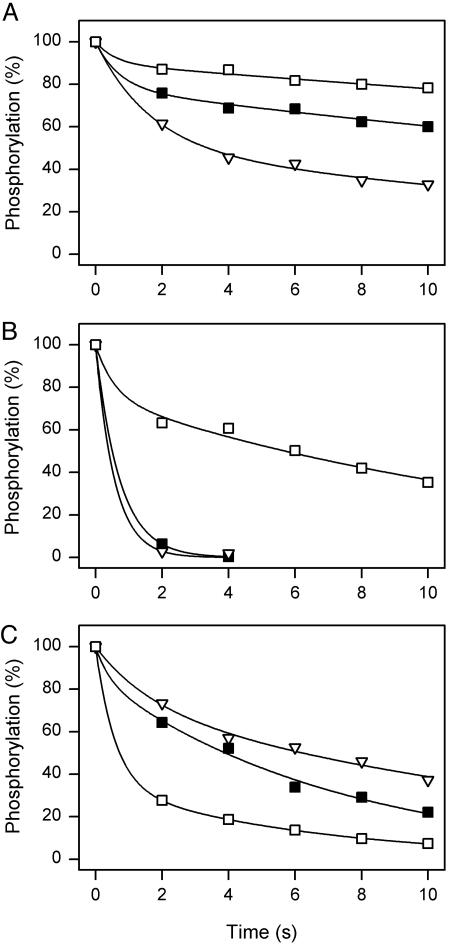
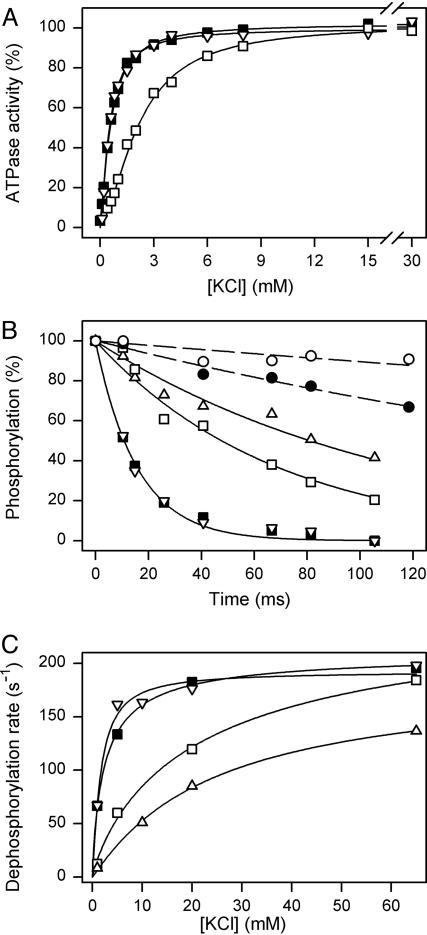
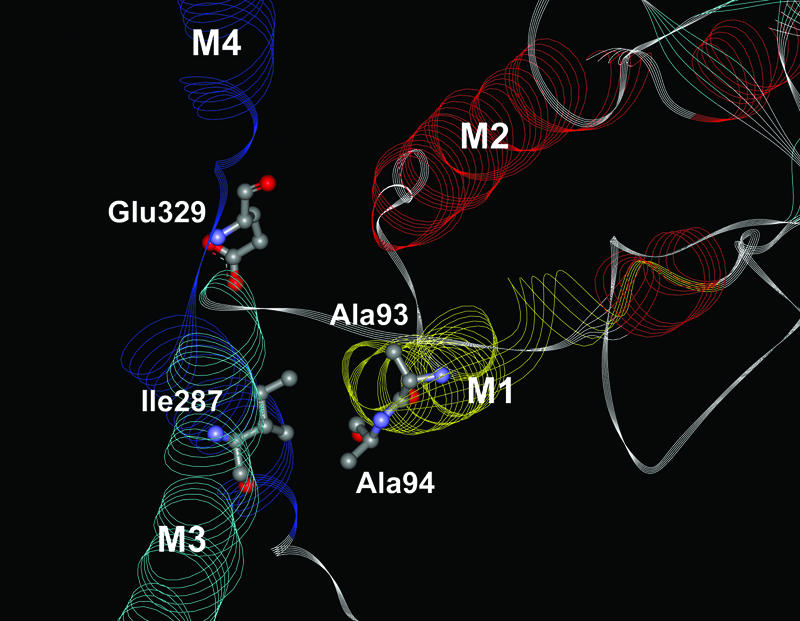
The importance of Gly-93 and Gly-94 in transmembrane segment M1 of the Na+,K+-ATPase for interaction with Na+ and K+ was demonstrated by functional analysis of mutants Gly-93-Ala and Gly-94-Ala. In the crystal structures of the Ca2+-ATPase, the corresponding residues, Asp-59 and Leu-60, are located exactly where M1 bends. Rapid kinetic measurements of K+-induced dephosphorylation allowed determination of the affinity of the E2P phosphoenzyme intermediate for K+. In Gly-94-Ala, the K+ affinity was reduced 9-fold, i.e., to the same extent as seen for mutation of the cation-binding residue Glu-329. Furthermore, Gly-94-Ala showed strongly reduced sensitivity of the E1P-E2P equilibrium to Na+, with accumulation of E2P even at 600 mM Na+, indicating that interaction of E2P with extracellular Na+ is impaired. On the contrary, in Gly-93-Ala, the affinity for K+ was slightly increased, and the E1P-E2P equilibrium was displaced in favor of E1P. In both mutants, the affinity of the cytoplasmically facing sites of E1 for Na+ was reduced, but this effect was relatively small compared with the effects seen for E2P in Gly-94-Ala. Comparison with Ca2+-ATPase mutagenesis data suggests that the role of M1 in binding of the transported ions is universal among P-type ATPases, despite the low sequence homology in this region. Structural modeling of Na+,K+-ATPase mutant Gly-94-Ala on the basis of the Ca2+-ATPase crystal structures indicates that the alanine side chain comes close to Ile-287 of M3, particularly in E2P, thus resulting in a steric clash that may explain the present observations.
Figures

Similar articles
-
Leucine 332 at the boundary between the fourth transmembrane segment and the cytoplasmic domain of Na+,K+-ATPase plays a pivotal role in the ion translocating conformational changes.Biochemistry. 1997 Oct 28;36(43):13312-24. doi: 10.1021/bi971030q. Biochemistry. 1997. PMID: 9341223
-
Functional consequences of alterations to Ile279, Ile283, Glu284, His285, Phe286, and His288 in the NH2-terminal part of transmembrane helix M3 of the Na+,K(+)-ATPase.J Biol Chem. 2003 Oct 3;278(40):38653-64. doi: 10.1074/jbc.M305521200. Epub 2003 Jul 7. J Biol Chem. 2003. PMID: 12847095
-
Interaction between the catalytic site and the A-M3 linker stabilizes E2/E2P conformational states of Na+,K+-ATPase.J Biol Chem. 2005 Mar 18;280(11):10210-8. doi: 10.1074/jbc.M411214200. Epub 2004 Nov 30. J Biol Chem. 2005. PMID: 15574410
-
Role of conserved TGDGVND-loop in Mg2+ binding, phosphorylation, and energy transfer in Na,K-ATPase.J Bioenerg Biomembr. 2001 Oct;33(5):367-77. doi: 10.1023/a:1010611322024. J Bioenerg Biomembr. 2001. PMID: 11762912 Review.
-
Structure-function relationships of Na(+), K(+), ATP, or Mg(2+) binding and energy transduction in Na,K-ATPase.Biochim Biophys Acta. 2001 May 1;1505(1):57-74. doi: 10.1016/s0005-2728(00)00277-2. Biochim Biophys Acta. 2001. PMID: 11248189 Review.
Cited by
-
Inhibition of phosphorylation of na+,k+-ATPase by mutations causing familial hemiplegic migraine.J Biol Chem. 2012 Jan 13;287(3):2191-202. doi: 10.1074/jbc.M111.323022. Epub 2011 Nov 23. J Biol Chem. 2012. PMID: 22117059 Free PMC article.
-
Review. Peering into an ATPase ion pump with single-channel recordings.Philos Trans R Soc Lond B Biol Sci. 2009 Jan 27;364(1514):229-38. doi: 10.1098/rstb.2008.0243. Philos Trans R Soc Lond B Biol Sci. 2009. PMID: 18986966 Free PMC article. Review.
-
The structure of the Na+,K+-ATPase and mapping of isoform differences and disease-related mutations.Philos Trans R Soc Lond B Biol Sci. 2009 Jan 27;364(1514):217-27. doi: 10.1098/rstb.2008.0201. Philos Trans R Soc Lond B Biol Sci. 2009. PMID: 18957371 Free PMC article.
-
Understanding the impacts of missense mutations on structures and functions of human cancer-related genes: A preliminary computational analysis of the COSMIC Cancer Gene Census.PLoS One. 2019 Jul 19;14(7):e0219935. doi: 10.1371/journal.pone.0219935. eCollection 2019. PLoS One. 2019. PMID: 31323058 Free PMC article.
-
HMA6 and HMA8 are two chloroplast Cu+-ATPases with different enzymatic properties.Biosci Rep. 2015 Apr 20;35(3):e00201. doi: 10.1042/BSR20150065. Biosci Rep. 2015. PMID: 26182363 Free PMC article.
References
Publication types
MeSH terms
Substances
LinkOut - more resources
Full Text Sources
Medical
Miscellaneous
