Chromogranin A deficiency in transgenic mice leads to aberrant chromaffin granule biogenesis
- PMID: 16049171
- PMCID: PMC6724839
- DOI: 10.1523/JNEUROSCI.1058-05.2005
Chromogranin A deficiency in transgenic mice leads to aberrant chromaffin granule biogenesis
Abstract
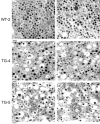
The biogenesis of dense-core secretory granules (DCGs), organelles responsible for the storage and secretion of neurotransmitters and neuropeptides in chromaffin cells, is poorly understood. Chromogranin A (CgA), which binds catecholamines for storage in the lumen of chromaffin granules, has been shown to be involved in DCG biogenesis in neuroendocrine PC12 cells. Here, we report that downregulation of CgA expression in vivo by expressing antisense RNA against CgA in transgenic mice led to a significant reduction in DCG formation in adrenal chromaffin cells. The number of DCGs formed in CgA antisense transgenic mice was directly correlated with the amount of CgA present in adrenal medulla. In addition, DCGs showed an increase in size, with enlargement in the volume around the dense core, a phenomenon that occurs to maintain constant "free" catecholamine concentration in the lumen of these granules. The extent of DCG swelling was inversely correlated with the number of DCGs formed, as well as the amount of CgA present in the adrenal glands of CgA antisense transgenic mice. These data indicate an essential role of CgA in regulating chromaffin DCG biogenesis and catecholamine storage in vivo.
Figures


Similar articles
-
Protease nexin-1 promotes secretory granule biogenesis by preventing granule protein degradation.Mol Biol Cell. 2006 Feb;17(2):789-98. doi: 10.1091/mbc.e05-08-0755. Epub 2005 Nov 30. Mol Biol Cell. 2006. PMID: 16319172 Free PMC article.
-
Impact of Chromogranin A deficiency on catecholamine storage, catecholamine granule morphology and chromaffin cell energy metabolism in vivo.Cell Tissue Res. 2016 Mar;363(3):693-712. doi: 10.1007/s00441-015-2316-3. Epub 2015 Nov 16. Cell Tissue Res. 2016. PMID: 26572539 Free PMC article.
-
Targeted ablation of the chromogranin a (Chga) gene: normal neuroendocrine dense-core secretory granules and increased expression of other granins.Mol Endocrinol. 2006 Aug;20(8):1935-47. doi: 10.1210/me.2005-0398. Epub 2006 Mar 23. Mol Endocrinol. 2006. PMID: 16556729
-
Chromogranin A: a surprising link between granule biogenesis and hypertension.J Clin Invest. 2005 Jul;115(7):1711-3. doi: 10.1172/JCI25706. J Clin Invest. 2005. PMID: 16007250 Free PMC article. Review.
-
Role of calcium in secretion and synthesis in bovine adrenal chromaffin cells.Adv Exp Med Biol. 1990;269:93-7. doi: 10.1007/978-1-4684-5754-4_14. Adv Exp Med Biol. 1990. PMID: 2191566 Review. No abstract available.
Cited by
-
Protease nexin-1 promotes secretory granule biogenesis by preventing granule protein degradation.Mol Biol Cell. 2006 Feb;17(2):789-98. doi: 10.1091/mbc.e05-08-0755. Epub 2005 Nov 30. Mol Biol Cell. 2006. PMID: 16319172 Free PMC article.
-
Tuning the Size of Large Dense-Core Vesicles and Quantal Neurotransmitter Release via Secretogranin II Liquid-Liquid Phase Separation.Adv Sci (Weinh). 2022 Sep;9(27):e2202263. doi: 10.1002/advs.202202263. Epub 2022 Jul 27. Adv Sci (Weinh). 2022. PMID: 35896896 Free PMC article.
-
Pro-hormone secretogranin II regulates dense core secretory granule biogenesis in catecholaminergic cells.J Biol Chem. 2010 Mar 26;285(13):10030-10043. doi: 10.1074/jbc.M109.064196. Epub 2010 Jan 8. J Biol Chem. 2010. PMID: 20061385 Free PMC article.
-
Chromogranin A promotes peptide hormone sorting to mobile granules in constitutively and regulated secreting cells: role of conserved N- and C-terminal peptides.J Biol Chem. 2009 May 1;284(18):12420-31. doi: 10.1074/jbc.M805607200. Epub 2009 Jan 29. J Biol Chem. 2009. PMID: 19179339 Free PMC article.
-
Dense-core vesicle biogenesis and exocytosis in neurons lacking chromogranins A and B.J Neurochem. 2018 Feb;144(3):241-254. doi: 10.1111/jnc.14263. Epub 2017 Dec 27. J Neurochem. 2018. PMID: 29178418 Free PMC article.
References
-
- Albillos A, Dernick G, Horstmann H, Almers W, Alvarez de Toledo G, Lindau M (1997) The exocytotic event in chromaffin cells revealed by patch amperometry. Nature 389: 509-512. - PubMed
-
- Arnaoutova I, Smith AM, Coates LC, Sharpe JC, Dhanvantari S, Snell CR, Birch NP, Loh YP (2003) The prohormone processing enzyme PC3 is a lipid raft-associated transmembrane protein. Biochemistry (Mosc) 42: 10445-10455. - PubMed
-
- Beuret N, Stettler H, Renold A, Rutishauser J, Spiess M (2004) Expression of regulated secretory proteins is sufficient to generate granule-like structures in constitutively secreting cells. J Biol Chem 279: 20242-20249. - PubMed
MeSH terms
Substances
LinkOut - more resources
Full Text Sources
Molecular Biology Databases
Research Materials
