. 2005 Jul 27;25(30):6984-96.
doi: 10.1523/JNEUROSCI.1137-05.2005.

Interaction via a key tryptophan in the I-II linker of N-type calcium channels is required for beta1 but not for palmitoylated beta2, implicating an additional binding site in the regulation of channel voltage-dependent properties

Affiliations

Interaction via a key tryptophan in the I-II linker of N-type calcium channels is required for beta1 but not for palmitoylated beta2, implicating an additional binding site in the regulation of channel voltage-dependent properties

Jérôme Leroy et al. J Neurosci. .

Erratum in

  • J Neurosci. 2005 Oct 5;25(40):table of contents. Richards, Mark S [corrected to Richards, Mark W]

Abstract

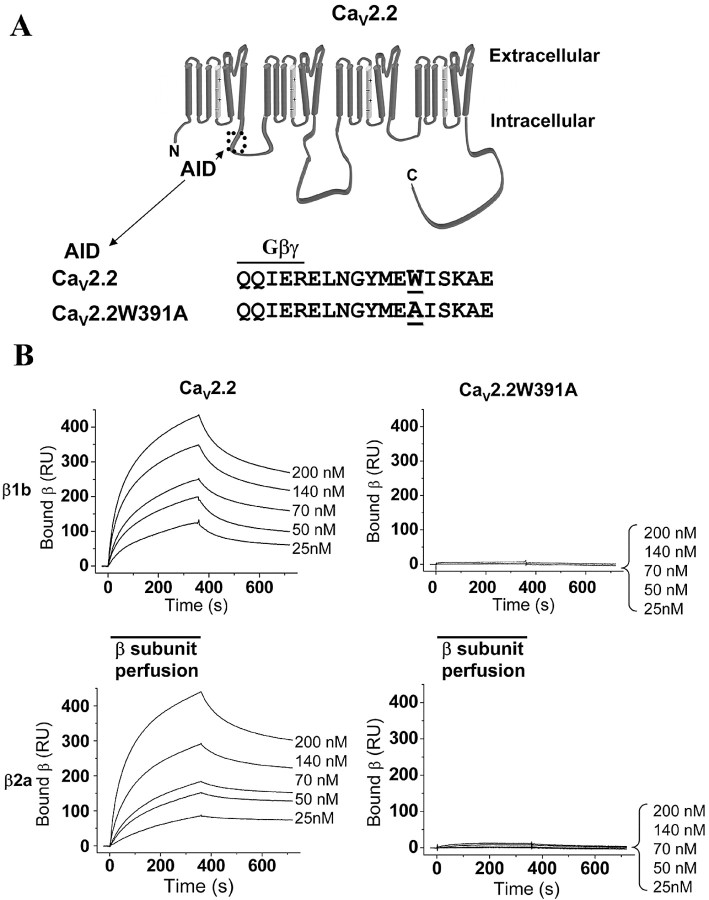
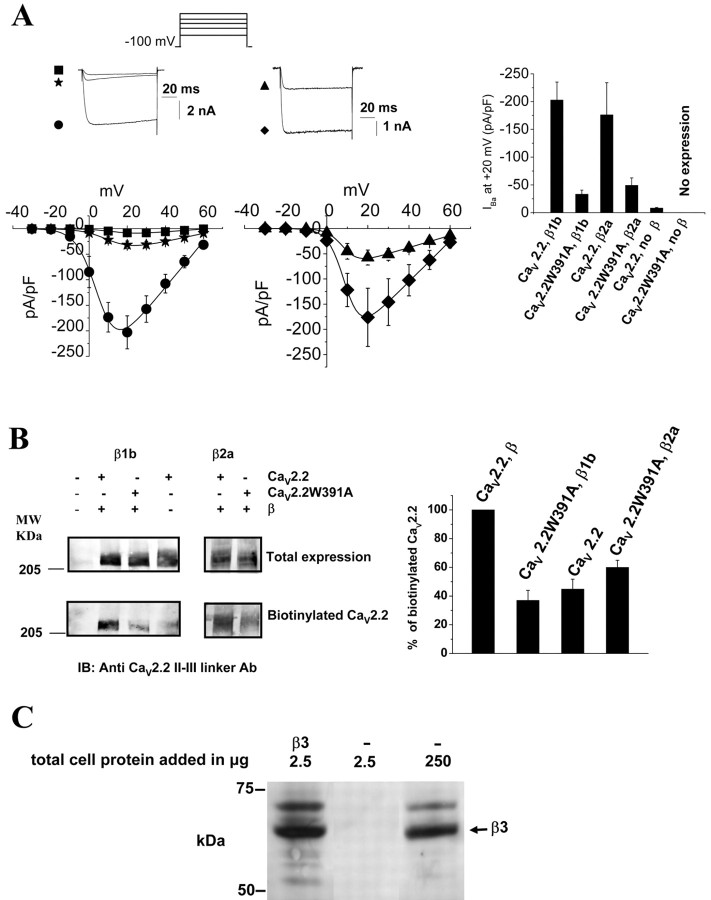
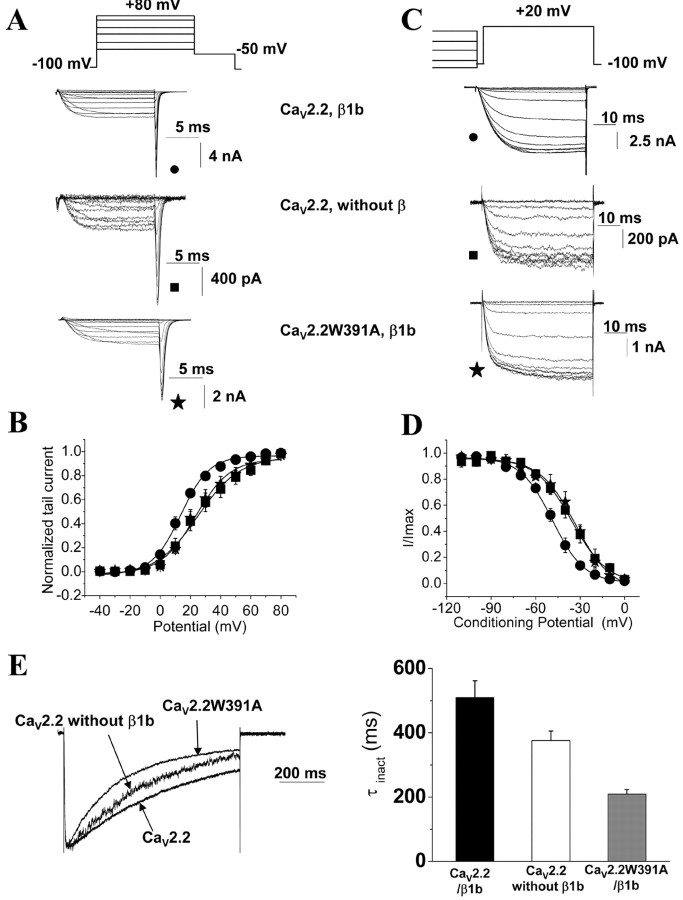
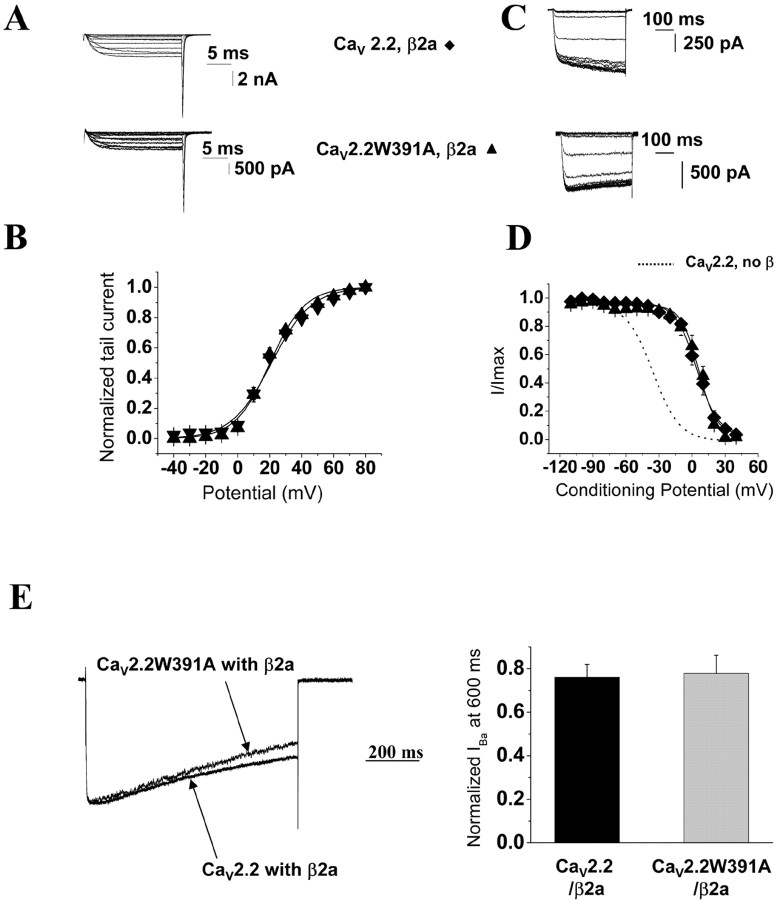
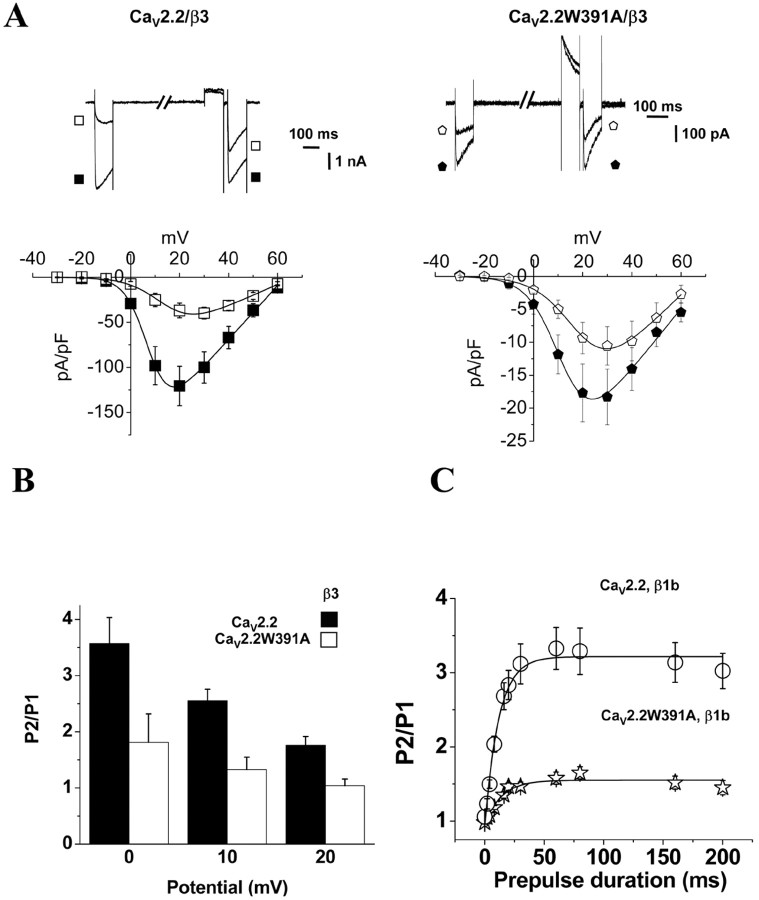
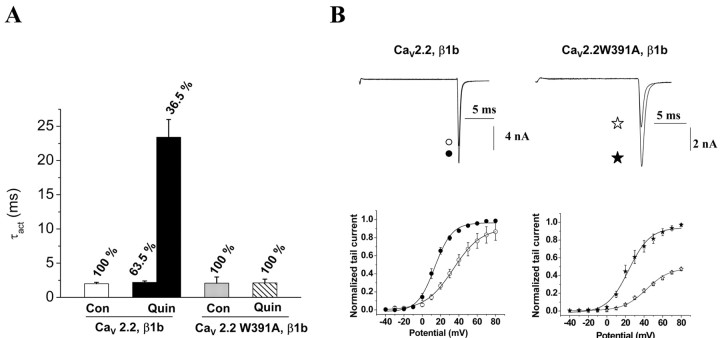
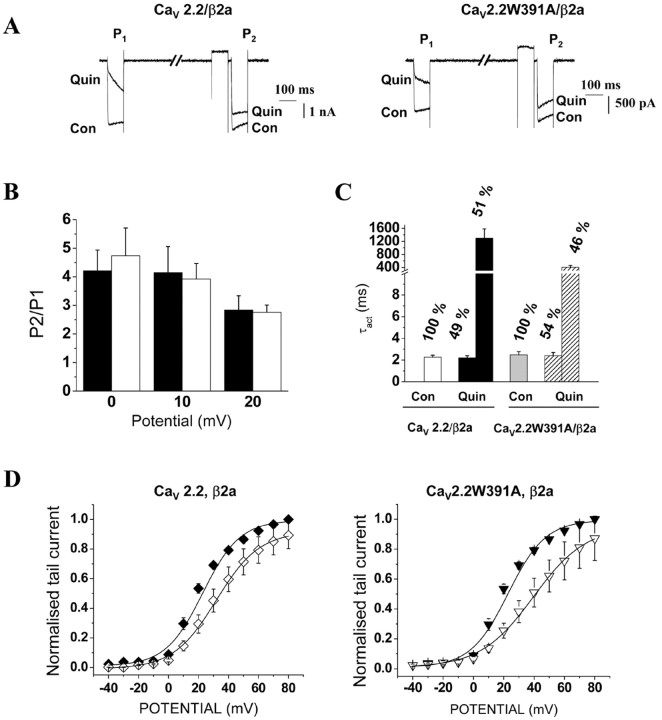
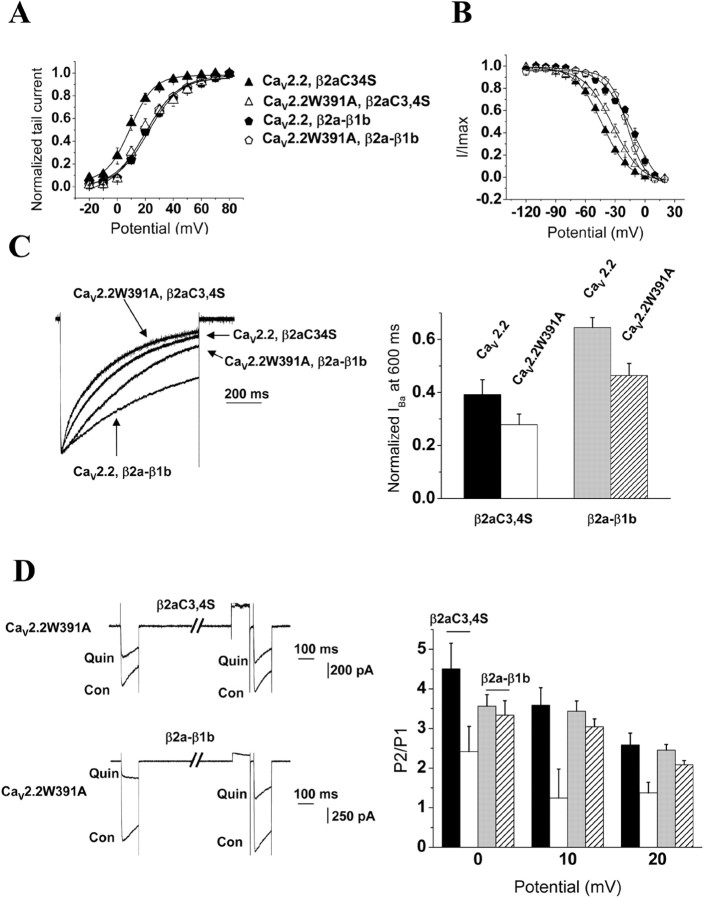
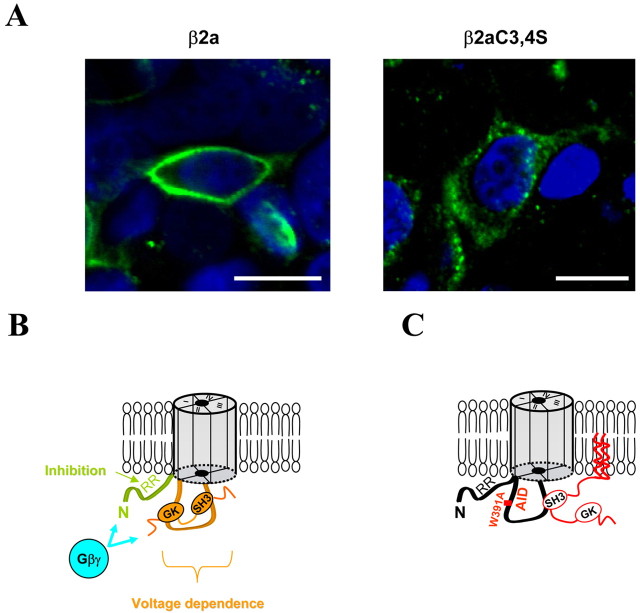
The CaVbeta subunits of voltage-gated calcium channels regulate these channels in several ways. Here we investigate the role of these auxiliary subunits in the expression of functional N-type channels at the plasma membrane and in the modulation by G-protein-coupled receptors of this neuronal channel. To do so, we mutated tryptophan 391 to an alanine within the alpha-interacting domain (AID) in the I-II linker of CaV2.2. We showed that the mutation W391 virtually abolishes the binding of CaVbeta1b and CaVbeta2a to the CaV2.2 I-II linker and strongly reduced current density and cell surface expression of both CaV2.2/alpha2delta-2/beta1b and/beta2a channels. When associated with CaVbeta1b, the W391A mutation also prevented the CaVbeta1b-mediated hyperpolarization of CaV2.2 channel activation and steady-state inactivation. However, the mutated CaV2.2W391A/beta1b channels were still inhibited to a similar extent by activation of the D2 dopamine receptor with the agonist quinpirole. Nevertheless, key hallmarks of G-protein modulation of N-type currents, such as slowed activation kinetics and prepulse facilitation, were not observed for the mutated channel. In contrast, CaVbeta2a was still able to completely modulate the biophysical properties of CaV2.2W391A channel and allow voltage-dependent G-protein modulation of CaV2.2W391A. Additional data suggest that the concentration of CaVbeta2a in the proximity of the channel is enhanced independently of its binding to the AID by its palmitoylation. This is essentially sufficient for all of the functional effects of CaVbeta2a, which may occur via a second lower-affinity binding site, except trafficking the channel to the plasma membrane, which requires interaction with the AID region.


Figures

Figure 1.
Figure 1.
The W391A mutation prevents the binding of CaVβ1b and CaVβ2a to CaV2.2 I-II linker. A, Representation of the CaV2.2 subunit that is composed of four domains of six transmembrane segments each. The I-II linker contains an 18 amino acid domain (AID) that interacts with CaVβ subunits (dotted box). The sequence of the AID within CaV2.2 and CaV2.2W391A are given below, with W391 underlined and also showing the putative overlapping binding motif for Gβγ dimer binding. B, Representative Biacore sensorgrams showing interactions between CaVβ1b (top) or CaVβ2a (bottom) with I-II loop GST-fusion proteins from CaV2.2 (left) and CaV2.2W391A (right). The auxiliary CaVβ subunits (25-200 nm as indicated) were applied during the time indicated by the bars.
Figure 2.
Figure 2.
Role of CaVβ subunits in plasma membrane expression of CaV2.2. A, Left, I-V relationships for CaV2.2/α2δ-2 coexpressed with CaVβ1b (filled circles, left; n = 18) or CaVβ2a (diamonds, right; n = 13) or without a CaVβ subunit (filled squares, left; n = 13) compared with I-V relationships for CaV2.2W391A/α2δ-2 coexpressed with CaVβ1b (filled stars, left; n = 11) or CaVβ2a (filled triangles, right; n = 14). The mean data are fitted with a modified Boltzmann function (see Materials and Methods), the V50, act and Gmax values of which are given in Table 1. Typical Ba2+ current traces at +20 mV (identified by the symbols used) are shown above the I-V relationships. Right, Mean current density at +20 mV for each of these combinations ± SEM. B, Cell surface expression of either CaV2.2 or CaV2.2WA391A expressed with α2δ-2, either without CaVβ or with CaVβ1b (left) or with CaVβ2a (right). Total expression of CaV2.2 is shown by Western blot in the top row and biotinylated CaV2.2 in the bottom row. Cells were transfected with empty vector (lane 1), CaV2.2/α2δ-2/β1b (lane 2), CaV2.2W391A/α2δ-2/β1b (lane 3), CaV2.2/α2δ-2 (lane 4), CaV2.2/α2δ-2/β2a (lane 5), or CaV2.2W391A/α2δ-2/β2a (lane 6). Note that only the cell surface expression is affected similarly by the W391A mutation or by the absence of CaVβ. Right, Histogram showing quantification of the mean amount of CaV2.2WA391A expressed at the plasma membrane, when coexpressed with either β1b or β2a, or CaV2.2 without CaVβ, given as a percentage of the amount of CaV2.2 expressed with the relevant CaVβ present under the same conditions. Data are mean ± SEM of four independent experiments. MW, Molecular weight. C, Western blot illustrating the endogenous expression of CaVβ3 in tsA-201 cells. Gel loaded with 2.5 μg of protein prepared from cells transfected with CaVβ3 (lane 1) compared with 2.5 or 250 μg of protein from cells transfected with an empty pMT2 vector (lanes 2, 3). An anti-β3 monoclonal antibody was used for immunoblotting.
Figure 3.
Figure 3.
Biophysical properties of CaV2.2 and CaV2.2W391A coexpressed with CaVβ1b. A, Representative current traces to illustrate current activation. Ba2+ tail currents were recorded after repolarizing to -50 mV after a 20 ms test pulse to between -40 and +80 mV from a holding potential of -100 mV. Top, CaV2.2/β1b; middle, CaV2.2 without any CaVβ; bottom, CaV2.2W391A/β1b, all coexpressed with α2δ-2. B, Voltage dependence of activation of CaV2.2/α2δ-2 coexpressed with CaVβ1b (filled circles) or without any CaVβ subunit (filled squares) or CaV2.2W391A/α2δ-2 expressed with CaVβ1b (filled stars). The normalized data, obtained from recordings such as those shown in A, are plotted against the test pulse (n = 6-19). The mean data are fitted with a Boltzmann function, the V50, act values of which are given in Table 1. C, Representative current traces (labeled as in A) to illustrate steady-state inactivation protocols. Inward Ba2+ currents were recorded after conditioning pulses of 5 s duration, applied from a holding potential of -100 mV in 10 mV steps between -110 and +30 mV, followed by a 50 ms test pulse to +20 mV. D, Voltage dependence of steady-state inactivation of CaV2.2/α2δ-2 coexpressed with CaVβ1b (filled circles) or without any CaVβ subunit (filled squares) or CaV2.2W391A/α2δ-2 expressed with CaVβ1b (filled stars). The normalized data obtained from recordings such as those shown in C are plotted against the conditioning potentials (n = 6-19). The mean data are fitted with a Boltzmann function, the V50,inact values of which are given in Table 1. E, Left, Superposition of representative current traces for the subunit combinations indicated, recorded during an 800 ms depolarizing step to +20 mV, from a holding potential of -100 mV, normalized to the peak current. Right, Mean time constants of inactivation (τinact) obtained by fitting the decaying phase of the Ba2+ currents at +20 mV with a single exponential, for CaV2.2/α2δ-2/β1b (black bar; n = 25), CaV2.2/α2δ-2 (white bar; n = 25), and CaV2.2W391A/α2δ-2/β1b (gray bar; n = 14).
Figure 4.
Figure 4.
Biophysical properties of CaV2.2 and CaV2.2WA391A coexpressed with CaVβ2a. A, Representative current traces to illustrate current activation using the same protocols as described in the legend to Figure 3. Top, CaV2.2/β2a; bottom, CaV2.2W391A/β2a, all coexpressed with α2δ-2. B, Voltage dependence of activation for CaV2.2/α2δ-2 coexpressed with CaVβ2a (filled diamonds; n = 10) or CaV2.2W391A/α2δ-2 expressed with CaVβ2a (filled triangles; n = 12). The normalized data obtained from recordings such as those shown in A are plotted against the test pulse. The mean data are fitted with a Boltzmann function, the V50, act values of which are given in Table 1. C, Representative current traces to illustrate steady-state inactivation using the same protocols as described in the legend to Figure 3. Top, CaV2.2/β2a; bottom, CaV2.2W391A/β2a. D, Voltage dependence of steady-state inactivation for CaV2.2/α2δ-2 coexpressed with CaVβ2a (filled diamonds; n = 17) or CaV2.2W391A/α2δ-2 expressed with CaVβ2a (filled triangles; n = 18). The normalized data obtained from recordings such as those shown in C are plotted against the conditioning potentials. The mean data are fitted with a Boltzmann function, the V50, inact values of which are given in Table 1. The dotted line represents the fit for CaV2.2 without CaVβ from Figure 3D. E, Left, Superposition of representative current traces for the subunit combinations indicated, recorded during an 800 ms depolarizing step to +20 mV, from a holding potential of -100 mV and normalized to the peak current. Right, Normalized residual IBa at 600 ms, for CaV2.2/α2δ-2/β2a (black bar; n = 15) and CaV2.2W391A/α2δ-2/β2a (gray bar; n = 14).
Figure 5.
Figure 5.
G-protein modulation of CaV2.2 and CaV2.2W391A expressed with CaVβ1b. Top, The pulse protocol used is depicted. A 100 ms test pulse (P1) from -30 to +60 mV was applied from a holding potential of -100 mV. After 800 ms repolarization to -100 mV, a 100 ms prepulse to +100 mV was applied. The cell was repolarized for 20 ms to -100 mV, and a second pulse (P2) identical to the first one was applied. A, D, Typical current traces obtained with this protocol are represented for CaV2.2 (top) and CaV2.2W391A (bottom) coexpressed with CaVβ1b. In A, the D2 dopamine receptor is coexpressed, and the top current traces (depicted by the open symbols) are in the presence of the agonist quinpirole (100 nm). In D, Gβ1γ2 are coexpressed, and typical traces for CaV2.2/β1b and CaV2.2W391A/β1b are shown. B, I-V curves for the calcium channel combinations are shown, obtained before (filled symbols) and during (open symbols) application of 100 nm quinpirole. Top, I-V curves for CaV2.2/α2δ-2 coexpressed with CaVβ1b (circles; n = 18) Bottom, I-V curves for CaV2.2W391A/α2δ-2 coexpressed with CaVβ1b (stars; n = 11) are represented. I-V curves are fitted with modified Boltzmann functions, the V50, act and Gmax parameters of which are given in Table 1. E, Top, I-V curves for Ba2+ currents during P1 for CaV2.2/α2δ-2/β1b coexpressed without (filled circles; n = 6) or with (open triangles; n = 9) Gβ1γ2. Bottom, For CaV2.2W391A/α2δ-2/β1b coexpressed without (stars; n = 6) or with (open squares; n = 8) Gβ1γ2. I-V curves obtained from currents recorded during P2 when Gβ1γ2 was coexpressed with CaV2.2/α2δ-2/β1b (filled triangles; n = 9) or CaV2.2W391A/α2δ-2/β1b (filled squares; n = 8) are also represented. All data were obtained in parallel on the same experimental days. C, Voltage-dependent facilitation was calculated by dividing the peak current value obtained in P2 by that obtained in P1 at the potentials of 0, +10, and +20 mV, for CaV2.2/α2δ-2 with CaVβ1b (black bars; n = 18), CaV2.2W391A/α2δ-2 with CaVβ1b (white bars; n = 11) after application of quinpirole, or when Gβ1γ2 were coexpressed with CaV2.2/β1b (gray bars; n = 9), CaV2.2W391A/β1b (hatched bars; n = 8). F, Typical current traces at +20 mV for R52, 54ACaV2.2W391A (top) coexpressed with CaVβ1b before (filled circles) and after (open circles) activation of the D2 dopamine receptor. Corresponding I-V curves are represented in the bottom.
Figure 6.
Figure 6.
The kinetics of inactivation do not contaminate the properties of G-protein modulation of CaV2.2 and CaV2.2W391A. A, Typical current traces obtained for CaV2.2/α2δ-2 and CaV2.2W391A/α2δ-2 coexpressed with CaVβ3 and the D2 dopamine receptor are represented (top). I-V curves obtained for these combinations before (filled symbols) and during (100 nm) application of quinpirole (open symbols) are also shown (bottom). B, Voltage-dependent facilitation for CaV2.2/α2δ-2 (black bars; n = 7) or CaV2.2W391A/α2δ-2 coexpressed with CaVβ3 (white bars; n = 7) obtained from the P2/P1 ratio when the D2 dopamine receptor was activated by 100 nm quinpirole. C, Facilitation rate of G-protein-modulated channels. The duration of the prepulse was increased from 0 to 200 ms. The P2/P1 facilitation ratios are given for each prepulse, for CaV2.2 (open circles; n = 16) and CaV2.2W391A (open stars; n = 17) coexpressed with CaVβ1b. Data are fitted with a single exponential, the time constant (τfacil) of which is given in Results.
Figure 7.
Figure 7.
G-protein modulation of the kinetics and voltage dependence of activation of CaV2.2 and CaV2.2W391A coexpressed with β1b. A, The τact for currents recorded in P1 as described in Figure 5 before and during perfusion of quinpirole in cells transfected with CaV2.2/α2δ-2/CaVβ1b (white and black bars, respectively; n = 18) and with CaV2.2W391A/α2δ-2/β1b (gray and hatched bars, respectively; n = 11). For CaV2.2/α2δ-2/CaVβ1b in the presence of quinpirole, the data were fit by a double exponential with a fast τact and a slow τact, the percentage of each component being given above the bars. B, Activation curves derived from tail current amplitude measurements for CaV2.2/α2δ-2/β1b (left) and CaV2.2W391A/α2δ-2/β1b (right). Top, Typical tail current traces recorded after a test pulse to +80 mV before (filled symbols) and during (open symbols) application of 100 nm quinpirole. Bottom, Peak tail current density, before (filled symbols) and during (open symbols) application of quinpirole, for CaV2.2/α2δ-2/β1b (circles, left) or CaV2.2W391A/α2δ-2/β1b (stars, right). Data are the mean ± SEM of 12-19 cells, and the solid lines are Boltzmann functions fits, the parameters of which are given in Results.
Figure 8.
Figure 8.
G-protein modulation of the kinetics and voltage dependence of activation of CaV2.2 and CaV2.2W391A coexpressed with CaVβ2a. A, The effect of quinpirole (100 nm) is compared on the CaV2.2/α2δ-2/β2a (left) and CaV2.2W391A/α2δ-2/β2a (right) combinations. Representative currents traces using the P1/P2 pulse protocol shown in Figure 5, obtained before (Con) and during (Quin) application of 100 nm quinpirole. B, The P2/P1 facilitation ratios for CaV2.2/α2δ-2/β2a (black bars; n = 13) or CaV2.2W391A/α2δ-2/β2a (white bars; n = 14) at potentials between 0 and +20 mV are given. C, The τact values for currents activated by +20 mV steps before and during application of quinpirole. Values are given for CaV2.2/α2δ-2/β2a in control conditions (white bars) and in the presence of quinpirole (black bars; n = 13) or for the CaV2.2W391A (gray and hatched bars, respectively; n = 14). In the presence of quinpirole, the data were fit by two exponentials, with the percentage of the total represented by each component given above the bar. D, Activation derived from normalized tail current density before (filled symbols) and during (open symbols) application of quinpirole (100 nm) for the subunit combination CaV2.2/α2δ-2/β2a (left, diamonds; n = 10) or CaV2.2W391A/α2δ-2/β2a (right, triangles; n = 12). The solid lines are Boltzmann function fits to the mean data, the parameters of which are given in Results.
Figure 9.
Figure 9.
Effect of palmitoylation of CaVβ subunits on the modulation of CaV2.2 and CaV2.2W391A channels. A, Voltage dependence of activation of CaV2.2 (filled symbols) or CaV2.2W391A (open symbols) with either CaVβ2aC3,4S (triangles) or CaVβ2a-β1b chimera (pentagons) and α2δ-2. The solid lines are Boltzmann function fits to the mean data, the parameters of which are given in Results. B, Voltage dependence of steady-state inactivation of CaV2.2 (filled symbols) or CaV2.2W391A (open symbols) with either CaVβ2aC3,4S (triangles) or CaVβ2a-β1b chimera (pentagons) and α2δ-2. The solid lines are Boltzmann function fits to the mean data, the parameters of which are given in Results. C, Left, Representative Ba2+ current traces recorded during an 800 ms depolarizing step to +20 mV from a holding potential of -100 mV. Right, The normalized amount of residual current at 600 ms, obtained for CaV2.2 or CaV2.2W391A coexpressed with α2δ-2 and CaVβ2aC3,4S (black and white bars, respectively; n = 18 for both) or the CaVβ2a-β1b chimera (gray and hatched bars; n = 23 and n = 19, respectively). D, Left, The effect of quinpirole (100 nm) is compared for the subunit combinations CaV2.2W391A/α2δ-2/β2aC3,4S (top traces) and CaV2.2W391A/α2δ-2/β2a-β1b chimera (bottom traces). Representative currents traces using the P1/P2 pulse protocol shown in Figure 5, obtained before (Con) and during (Quin) application of 100 nm quinpirole. Right, The P2/P1 ratio obtained from such traces for CaV2.2 and CaV2.2W391A coexpressed with α2δ-2 and CaVβ2aC3,4S (black and white bars; n = 7 and n = 8, respectively) or the CaVβ2a-β1b chimera (gray and hatched bars; n = 12 and n = 11 respectively).
Figure 10.
Figure 10.
Proposed mechanism for G-protein modulation of CaV2.2 calcium channels and the effect of palmitoylation on the interaction of CaVβ subunits with the I-II linker. A, Confocal immunofluorescent images of β2a and β2aC3,4S subunits expressed in tsA-201 cells, using an anti-β2 antibody (green). Nuclei are visualized with DAPI (blue). Scale bars, 20 μm. Note the membrane localization of the β2a subunit (left), whereas the β2aC3,4S subunit is localized to the cytoplasm (right). B, Model for the mechanism of action of Gβγ binding to the channel to inhibit its activity. The N terminus of CaV2.2 containing two arginines (R52, R54) constitutes a motif implicated in the inhibition by G-proteins, whereas the voltage-dependent facilitation (loss of inhibition induced by strong depolarization) requires a bound CaVβ subunit on the I-II linker. C, The GK domain of CaVβ subunits interacts with the AID, allowing a low-affinity binding of its SH3 domain elsewhere on the channel (e.g., to the I-II loop of CaV2.2) (Maltez et al., 2005) to modulate the properties of the channel. Palmitoylation of CaVβ by anchoring the subunit to the plasma membrane allows this low-affinity interaction to occur when the W391 in the AID is mutated to disrupt its interaction with the GK domain.

Similar articles

Cited by

References

    1. Altier C, Dubel SJ, Barrere C, Jarvis SE, Stotz SC, Spaetgens RL, Scott JD, Cornet V, De Waard M, Zamponi GW, Nargeot J, Bourinet E (2002) Trafficking of L-type calcium channels mediated by the postsynaptic scaffolding protein AKAP79. J Biol Chem 277: 33598-33603. - PubMed
    1. Barclay J, Balaguero N, Mione M, Ackerman SL, Letts VA, Brodbeck J, Canti C, Meir A, Page KM, Kusumi K, Perez-Reyes E, Lander ES, Frankel WN, Gardiner RM, Dolphin AC, Rees M (2001) Ducky mouse phenotype of epilepsy and ataxia is associated with mutations in the Cacna2d2 gene and decreased calcium channel current in cerebellar Purkinje cells. J Neurosci 21: 6095-6104. - PMC - PubMed
    1. Bean BP (1989) Neurotransmitter inhibition of neuronal calcium currents by changes in channel voltage dependence. Nature 340: 153-156. - PubMed
    1. Bell DC, Butcher AJ, Berrow NS, Page KM, Brust PF, Nesterova A, Stauderman KA, Seabrook GR, Nurnberg B, Dolphin AC (2001) Biophysical properties, pharmacology, and modulation of human, neuronal L-type (α1D, CaV1.3) voltage-dependent calcium currents. J Neurophysiol 85: 816-827. - PubMed
    1. Berrou L, Klein H, Bernatchez G, Parent L (2002) A specific tryptophan in the I-II linker is a key determinant of β-subunit binding and modulation in CaV2.3 calcium channels. Biophys J 83: 1429-1442. - PMC - PubMed

Publication types

MeSH terms

LinkOut - more resources