. 2005 Jul 27;25(30):7081-9.
doi: 10.1523/JNEUROSCI.1379-05.2005.

Oscillatory bursts in the optic tectum of birds represent re-entrant signals from the nucleus isthmi pars parvocellularis

Affiliations

Oscillatory bursts in the optic tectum of birds represent re-entrant signals from the nucleus isthmi pars parvocellularis

Gonzalo Marín et al. J Neurosci. .

Erratum in

  • J Neurosci. 2005 Aug 3;25(31):table of contents. Mpdozis, Jorge [corrected to Mpodozis, Jorge]

Abstract

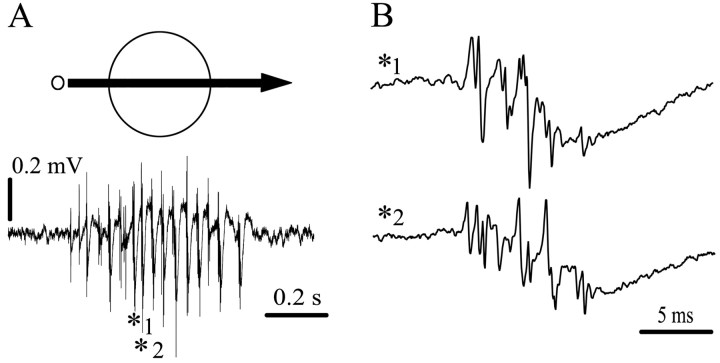
Fast oscillatory bursts (OBs; 500-600 Hz) are the most prominent response to visual stimulation in the optic tectum of birds. To investigate the neural mechanisms generating tectal OBs, we compared local recordings of OBs with simultaneous intracellular and extracellular single-unit recordings in the tectum of anesthetized pigeons. We found a specific population of units that responded with burst discharges that mirrored the burst pattern of OBs. Intracellular filling with biocytin of some of these bursting units demonstrated that they corresponded to the paintbrush axon terminals from the nucleus isthmi pars parvocellularis (Ipc). Direct recordings in the Ipc confirmed the high correlation between Ipc cell firing and tectal OBs. After injecting micro-drops of lidocaine in the Ipc, the OBs of the corresponding tectal locus disappeared completely. These results identify the paintbrush terminals as the neural elements generating tectal OBs. These terminals are presumably cholinergic and ramify across tectal layers in a columnar manner. Because the optic tectum and the Ipc are reciprocally connected such that each Ipc neuron sends a paintbrush axon to the part of the optic tectum from which its visual inputs come, tectal OBs represent re-entrant signals from the Ipc, and the spatial-temporal pattern of OBs across the tectum is the mirror representation of the spatial-temporal pattern of bursting neurons in the Ipc. We propose that an active location in the Ipc may act, via bursting paintbrushes in the tectum, as a focal "beam of attention" across tectal layers, enhancing the saliency of stimuli in the corresponding location in visual space.


Figures

Figure 1.
Figure 1.
Representative recordings of tectal OBs. A, OB response recorded with a tungsten microelectrode from the superficial layers of the tectum (depth, 300 μm). The response was evoked by moving a bright dot (2°, 45°/s) across an RF of∼25°. The signal was filtered between 10 Hz and 10 kHz. B, Two individual OBs (asterisks in A) expanded in time, showing their variability and oscillatory appearance. Each OB occurs during the descending phase of a negative potential.
Figure 2.
Figure 2.
Units with sustained responses are not synchronized to the OBs. A, B, Simultaneous recording of the OB response(top trace) and a single unit (bottom trace), with a superimposed RF, in response to a moving bright dot (visual angle, 2°; 40 °/s) from the superficial (A) and deep (B) layers. C, D, Time expansion of marked section of traces above. Note the lack of correlation between the firing of the unit and the OBs. E, F, The autocorrelograms as the histograms of spike times, expressed as probability of firing in 1 ms bins, showing the lack of temporal modulation of the units. STA of the OB traces using the unit spikes as the triggers. The amplitude is expressed in units of SD of the voltage of the averaged OB traces. The flat STA demonstrates the lack of correlation between the firing of the unit and the OBs. Up in all traces is negative.
Figure 3.
Figure 3.
Units with bursting responses are synchronized to the OBs. A, B, Simultaneous recording of the OB response (top trace) and a single unit (bottom trace), with a superimposed RF, in response to a moving bright dot (visual angle, 2°; 40 °/s) from the superficial (A) and deep (B) layers. The units discharge a burst of spikes during each OB recorded in the same tectal column. C, D, Time expansion of marked section of traces above. The spikes in D are large and positive, indicative of a close contact between the pipette and the unit, although no significant drop in the DC potential was discernible. E, F, The duration of the OB is tightly correlated with the duration of the burst of firing by units with the same RF (E, slope, 0.67, r 2 = 0.92; F, slope, 0.68, r 2 = 0.66). The STAs illustrate the synchrony of the burst response to the OBs. Note the ripple-like modulation of the STA near time 0, indicating that the intraburst firing of the unit occurs at constant latencies from the individual components of the OBs. The bottom curve in the STA graphs (displaced vertically for clarity) is a control STA obtained by shuffling the recording traces.
Figure 4.
Figure 4.
Units with bursting responses recorded in the intermediate and deep layers correspond to paintbrush terminals in the tectum coming from the Ipc. A, Paintbrush terminal stained after recording in layer 10. Note the column-like ramification of the terminals, starting in layer 10 and extending up to layer 2, with profuse branches in layer 5. B, Cell body in Ipc back-filled from the axon terminal shown in A.
Figure 5.
Figure 5.
Activity in the Ipc is synchronized to tectal OBs with superimposed RFs. A, Simultaneous recording of multiunit activity in the Ipc and tectal OBs with superimposed RFs in response to 20 ms, 4° stimulus flash. The Ipc RF was defined as the region of the visual field from which burst responses to flashing or visual motion stimulation were elicited (as shown in E). The flash elicits a sequence of three bursts in both the Ipc and tectum lasting 100 ms. The filled arrow marks the time of the flash. Note that the first tectal burst begins ∼25 ms after a negative tectal potential (open arrow). B, A similarly tight correlation is observed in response to a bright spot crossing the superimposed RFs. D, STA of the OBs traces in response to stimulus motion as in B, using the Ipc multiunit spikes as triggers shows the close correlation between the two responses. The bottom curve (displaced vertically for clarity) is a control STA obtained by shuffling the recording traces. E, Multiunit activity in the Ipc in response to a 2° spot moved horizontally from temporal to nasal in six sweeps separated by 8° vertically, as shown in C. The bursting response is elicited in a central area of <25° (encircled); the more sustained high-frequency activity is elicited by stimulation beyond this region. Time expansion of marked section of traces (asterisks) shows that the peripheral high-frequency response is composed of very regularly spaced negative spike-like activity. F, Intracellular recording of an Ipc neuron in response to the same stimulation shown in C. The RF diameter was ∼22°. Notice that the cell fires in bursts riding on fast depolarizations. The biocytin-filled cell body was located in the posterior third of the Ipc.
Figure 6.
Figure 6.
Injection of lidocaine in the Ipc eliminates OBs in the homotopic locus of the tectum. A, OBs were recorded from two sites in the optic tectum, one homotopic to the recording site in the Ipc (superimposed RF), the other 1.5 mm away (nonsuperimposed RF). Each trace represents the response to one sweep of the stimulus (2° bright dot, moved at 45 °/s in the horizontal axis). Lidocaine was injected using a double-barreled glass pipette as described in Materials and Methods. Three minutes after injecting lidocaine in the Ipc, the tectal OB response of the homotopic locus disappeared completely, whereas OBs recorded in the nonsuperimposed RF increased moderately. Both responses recovered in 6-10 min. B, Average number of bursts per second before and after lidocaine Ipc inactivation for different injection experiments. Bursts were counted and averaged during a fixed period of time for three sweeps of the stimulus across superimposed and nonsuperimposed RFs. Lines with the same symbol represent repetitions of the injections in the same pigeon (4 pigeons). C, Simultaneous recording of Ipc activity in the injected locus and tectal activity in the homotopic locus before and after lidocaine inactivation (same stimulation as in A). Note that all Ipc activity in the bursting part of the RF disappeared after the inactivation. Peripheral visual stimulation still evokes a strong high-frequency response in the Ipc site but with reverse polarity. The bottom traces are Ipc records expanded in time.
Figure 7.
Figure 7.
Diagram illustrating the synaptic relationships between the isthmi and the tectum (Wang et al., 2004). The Ipc is reciprocally connected to the tectum in a precise homotopic loop. Shepherd's crook neurons and other bipolar neurons from layer 10 project topographically to the Ipc via spatially restricted terminals, and Ipc neurons project back to the corresponding tectal loci via the columnar paintbrush axon terminals. The Imc receives a coarser topographic projection from similar neurons in layer 10 and projects back to the tectum and to the Ipc via widely ramifying terminal fields. The tectal terminals in both the Imc and Ipc are presumably glutamatergic and excitatory. Ipc paintbrush terminals are presumably cholinergic. Imc neurons are presumably GABAergic and make synaptic connections with inhibitory profiles on Ipc neurons. The present study proposes that a transient visual input from the retina produces a prolonged, bursting reciprocal activation of the tecto-Ipc loci, while inhibiting the rest of the Ipc and the tectum via the Imc wide-field projection (see Discussion). Black represents visually activated neural elements.

Similar articles

Cited by

References

    1. Bagnoli P, Fontanesi G, Alesci R, Erichsen J (1992) Distribution of neuropeptide Y, substance P, and choline acetyltransferase in the developing visual system of the pigeon and effects of unilateral retina removal. J Comp Neurol 318: 392-414. - PubMed
    1. Baizer JS, Whitney JF, Bender DB (1991) Bilateral projections from the parabigeminal nucleus to the superior colliculus in monkey. Exp Brain Res 86: 467-470. - PubMed
    1. Baker SN, Curio G, Lemon RN (2003) EEG oscillations at 600 Hz are macroscopic markers for cortical spike bursts. J Physiol (Lond) 550: 529-534. - PMC - PubMed
    1. Barth DS (2003) Submillisecond synchronization of fast electrical oscillations in neocortex. J Neurosci 23: 2502-2510. - PMC - PubMed
    1. Binns KE, Salt TE (2000) The functional influence of nicotinic cholinergic receptors on the visual responses of neurons in the superficial superior colliculus. Vis Neurosci 17: 283-289. - PubMed

Publication types

LinkOut - more resources