

Gap junctions of the medial collateral ligament: structure, distribution, associations and function
- PMID: 16050901
- PMCID: PMC1571515
- DOI: 10.1111/j.1469-7580.2005.00440.x
Gap junctions of the medial collateral ligament: structure, distribution, associations and function
Abstract
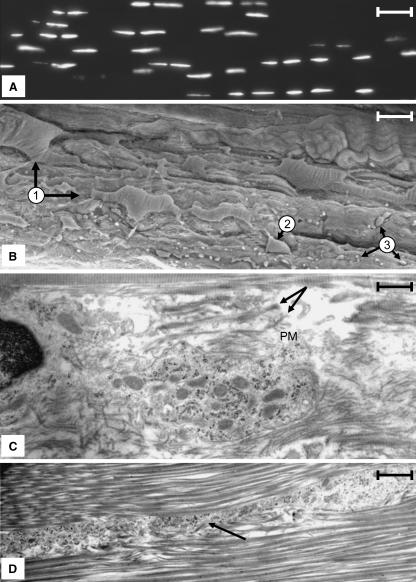
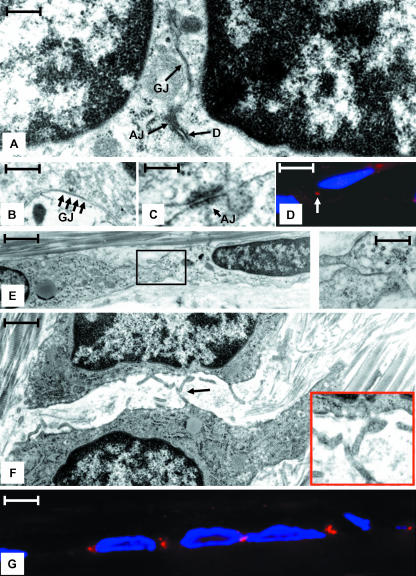
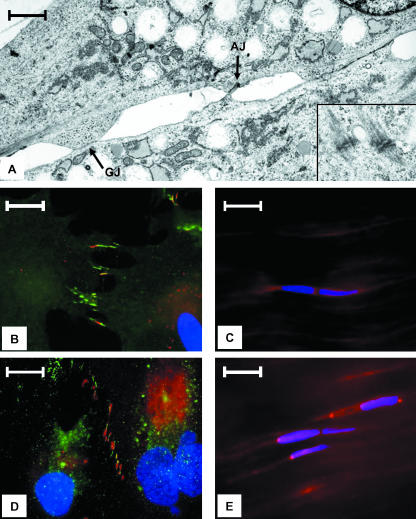
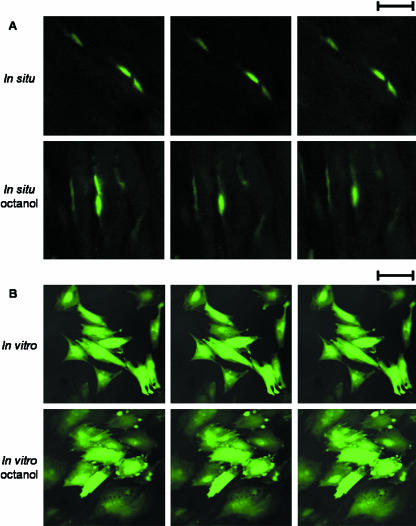
Ligaments are composed of two major components: cells and extracellular matrix. The cells express gap junction proteins and are arranged into a series of rows that traverse the tissue, suggesting that all the cells of the tissue are functionally interconnected. The results of our study demonstrate that medial collateral ligament (MCL) cells do not have a uniform fusiform morphology or placement along a row of cells as previously suggested, but rather display a complex placement and form that weaves within the collagen matrix in a manner that is far more extensive and complex than previously appreciated. Within this morphological context, we find that MCL cells in vivo contain functional gap junctions (verified using fluorescence recovery after photobleaching) that are localized to sites of close cell-cell contact, and this pattern imparts or reflects a bipolarity inherent to each cell. When we studied ligament cells in conventional tissue culture we found that this bipolarity is lost, and the placement of gap junctions and their related proteins, as well as general cell morphology, is also altered. Finally, our study demonstrates, for the first time, that in addition to gap junctions, adherens junctions and desmosomes are also expressed by MCL cells both in vivo and in vitro and map to sites of cell-cell contact.
Figures
Similar articles
-
Role of catenins in the development of gap junctions in rat cardiomyocytes.J Cell Biochem. 2003 Mar 1;88(4):823-35. doi: 10.1002/jcb.10390. J Cell Biochem. 2003. PMID: 12577316
-
Tendon cells in vivo form a three dimensional network of cell processes linked by gap junctions.J Anat. 1996 Dec;189 ( Pt 3)(Pt 3):593-600. J Anat. 1996. PMID: 8982835 Free PMC article.
-
Gap junctions and connexin-interacting proteins.Cardiovasc Res. 2004 May 1;62(2):233-45. doi: 10.1016/j.cardiores.2003.12.009. Cardiovasc Res. 2004. PMID: 15094344 Review.
-
Effects of 18beta-glycyrrhetinic acid on the junctional complex and steroidogenesis in rat adrenocortical cells.J Cell Biochem. 2003 Sep 1;90(1):33-41. doi: 10.1002/jcb.10610. J Cell Biochem. 2003. PMID: 12938154
-
Gap junctions revealed by freeze-fracture electron microscopy.Microsc Res Tech. 1995 Aug 1;31(5):437-45. doi: 10.1002/jemt.1070310512. Microsc Res Tech. 1995. PMID: 8534904 Review.
Cited by
-
Prevention of cisplatin-induced ototoxicity by the inhibition of gap junctional intercellular communication in auditory cells.Cell Mol Life Sci. 2014 Oct;71(19):3859-71. doi: 10.1007/s00018-014-1594-3. Epub 2014 Mar 13. Cell Mol Life Sci. 2014. PMID: 24623558 Free PMC article.
-
Assaying dynamic cell-cell junctional communication using noninvasive and quantitative fluorescence imaging techniques: LAMP and infrared-LAMP.Nat Protoc. 2009;4(1):94-101. doi: 10.1038/nprot.2008.219. Nat Protoc. 2009. PMID: 19131961
-
Functional assessment of gap junctions in monolayer and three-dimensional cultures of human tendon cells using fluorescence recovery after photobleaching.J Biomed Opt. 2014 Jan;19(1):15001. doi: 10.1117/1.JBO.19.1.015001. J Biomed Opt. 2014. PMID: 24390370 Free PMC article.
-
Regulation of Joint Tissues and Joint Function: Is There Potential for Lessons to Be Learned Regarding Regulatory Control from Joint Hypermobility Syndromes?Int J Mol Sci. 2025 Jan 31;26(3):1256. doi: 10.3390/ijms26031256. Int J Mol Sci. 2025. PMID: 39941023 Free PMC article. Review.
-
Connexins and pannexins in the skeleton: gap junctions, hemichannels and more.Cell Mol Life Sci. 2015 Aug;72(15):2853-67. doi: 10.1007/s00018-015-1963-6. Epub 2015 Jun 20. Cell Mol Life Sci. 2015. PMID: 26091748 Free PMC article. Review.
References
-
- Benjamin M, Ralphs JR. Tendons and ligaments – an overview. Histol Histopathol. 1997;12:1135–1144. - PubMed
-
- Benjamin M, Ralphs JR. The cell and developmental biology of tendons and ligaments. Int Rev Cytol. 2000;196:85–130. - PubMed
-
- Chen YH, DeHaan RL. Temperature dependence of embryonic cardiac gap junction conductance and channel kinetics. J Membr Biol. 1993;136:125–134. - PubMed
Publication types
MeSH terms
Substances
LinkOut - more resources
Full Text Sources
Miscellaneous
