

Baroreceptor reflex sensitivity in human neonates: the effect of postmenstrual age
- PMID: 16051623
- PMCID: PMC1474770
- DOI: 10.1113/jphysiol.2005.093641
Baroreceptor reflex sensitivity in human neonates: the effect of postmenstrual age
Abstract
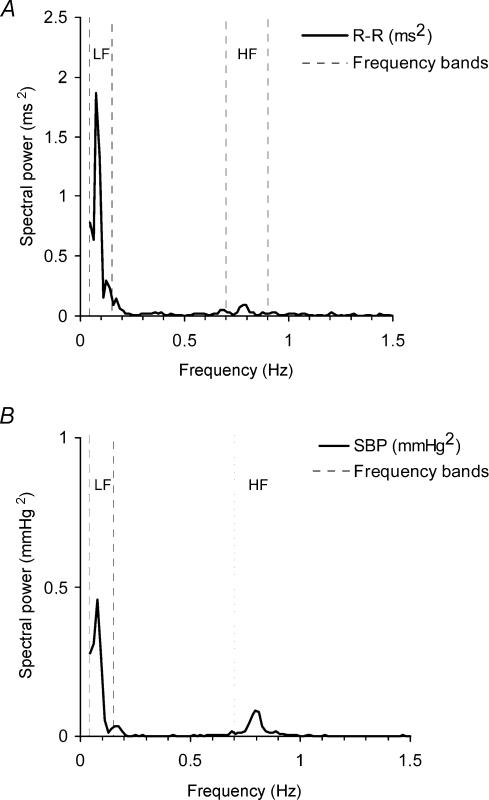
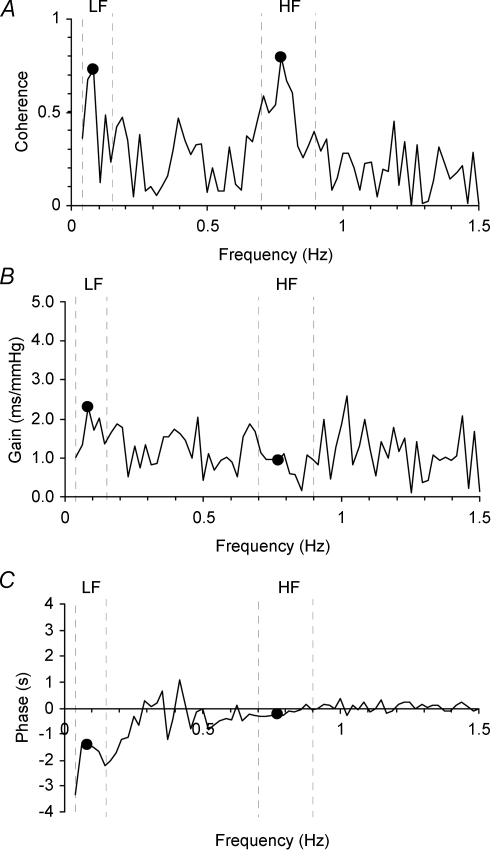
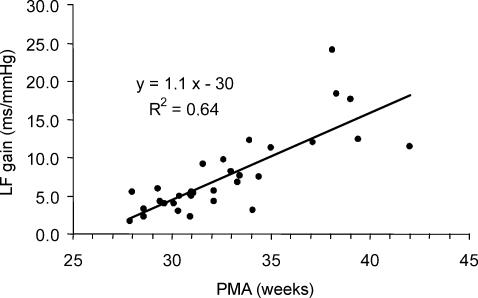
We performed a cross-sectional study in human infants to determine if indices of R-R interval variability, systolic blood pressure (SBP) variability, and baroreceptor reflex sensitivity change with postmenstrual age (PMA: gestational age+postnatal age). The electrocardiogram, arterial SBP and respiration were recorded in clinically stable infants (PMA, 28-42 weeks) in the quiet sleep state in the first days after birth. (Cross-)spectral analyses of R-R interval series and SBP series were performed to calculate the power of low-frequency (LF, indicating baroreceptor reflex activity, 0.04-0.15 Hz) and high-frequency (HF, indicating parasympathetic activity, individualized between the p-10 and p-90 values of respiratory frequency) fluctuations, and transfer function phase and gain. The mean R-R interval, and LF and HF spectral powers of R-R interval series increased with PMA. The mean SBP increased with PMA, but not the LF and HF spectral powers of SBP series. In the LF range, cross-spectral analysis showed high coherence values (>0.5) with a consistent negative phase shift between R-R interval and SBP, indicating a approximately 3 s lag in R-R interval changes in relation to SBP. Baroreceptor reflex sensitivity, calculated from LF transfer gain, increased significantly with PMA, from 5 (preterm) to 15 ms mmHg-1 (term). Baroreceptor reflex sensitivity correlated significantly with the (LF and) HF spectral powers of R-R interval series, but not with the LF and HF spectral powers of SBP series. The principal conclusions are that baroreceptor reflex sensitivity and spectral power in R-R interval series increase in parallel with PMA, suggesting a progressive vagal maturation with PMA.
Figures
Similar articles
-
Cardiovascular autonomic regulation in preterm infants: the effect of atropine.Pediatr Res. 2004 Dec;56(6):939-46. doi: 10.1203/01.PDR.0000145257.75072.BB. Epub 2004 Oct 6. Pediatr Res. 2004. PMID: 15470200 Clinical Trial.
-
Cardiovascular fluctuations and transfer function analysis in stable preterm infants.Pediatr Res. 2003 Jan;53(1):89-97. doi: 10.1203/00006450-200301000-00016. Pediatr Res. 2003. PMID: 12508086
-
The effects of metronome breathing on the variability of autonomic activity measurements.J Manipulative Physiol Ther. 2000 Nov-Dec;23(9):610-4. doi: 10.1067/mmt.2000.110944. J Manipulative Physiol Ther. 2000. PMID: 11145801
-
Effects of respiration on blood pressure and heart rate variability in humans.Clin Exp Pharmacol Physiol. 1991 Nov;18(11):735-42. doi: 10.1111/j.1440-1681.1991.tb01391.x. Clin Exp Pharmacol Physiol. 1991. PMID: 1782721 Review.
-
[Evaluation of autonomic nervous function by assessing baroreceptor reflex].Rinsho Shinkeigaku. 2014;54(12):1034-7. doi: 10.5692/clinicalneurol.54.1034. Rinsho Shinkeigaku. 2014. PMID: 25672701 Review. Japanese.
Cited by
-
Noninvasive assessment of autonomic function in human neonates born at the extremes of fetal growth spectrum.Physiol Rep. 2018 Apr;6(8):e13682. doi: 10.14814/phy2.13682. Physiol Rep. 2018. PMID: 29687617 Free PMC article.
-
Prone sleeping affects cardiovascular control in preterm infants in NICU.Pediatr Res. 2021 Jul;90(1):197-204. doi: 10.1038/s41390-020-01254-z. Epub 2020 Nov 10. Pediatr Res. 2021. PMID: 33173173
-
Mitigating the effect of non-stationarity in spectral analysis-an application to neonate heart rate analysis.Comput Biol Med. 2013 Dec;43(12):2001-6. doi: 10.1016/j.compbiomed.2013.09.019. Epub 2013 Oct 1. Comput Biol Med. 2013. PMID: 24290914 Free PMC article. Clinical Trial.
-
Autonomic nervous system in newborns: a review based on heart rate variability.Childs Nerv Syst. 2017 Jul;33(7):1053-1063. doi: 10.1007/s00381-017-3436-8. Epub 2017 May 13. Childs Nerv Syst. 2017. PMID: 28501900 Review.
-
History of blood pressure measurement in newborns and infants.Physiol Res. 2023 Nov 28;72(5):543-555. doi: 10.33549/physiolres.935173. Physiol Res. 2023. PMID: 38015754 Free PMC article. Review.
References
-
- Akselrod S, Gordon D, Madwed JB, Snidman NC, Shannon DC, Cohen RJ. Hemodynamic regulation: investigation by spectral analysis. Am J Physiol. 1985;249:H867–H875. - PubMed
-
- Andriessen P, Janssen BJA, Berendsen RCM, Bambang Oetomo S, Wijn PFF, Blanco CE. Cardiovascular autonomic regulation in preterm infants: the effect of atropine. Pediatr Res. 2004;56:939–946. - PubMed
-
- Andriessen P, Koolen AMP, Berendsen RCM, Wijn PFF, ten Broeke EDM, Oei SG, Blanco CE. Cardiovascular fluctuations and transfer function analysis in stable preterm infants. Pediatr Res. 2003;53:89–97. - PubMed
-
- Buckner PS, Maidens JM, Finer NN. Characterization of the neonatal heart rate baroreflex during and after ECMO. Early Hum Dev. 1993;32:49–61. - PubMed
-
- Chatow U, Davidson S, Reichman BL, Akselrod S. Development and maturation of the autonomic nervous system in premature and full-term infants using spectral analysis of heart rate fluctuations. Pediatr Res. 1995;37:294–302. - PubMed
MeSH terms
LinkOut - more resources
Full Text Sources
Medical
Research Materials
Miscellaneous