. 2005 Aug;79(16):10776-87.
doi: 10.1128/JVI.79.16.10776-10787.2005.

Caveola-dependent endocytic entry of amphotropic murine leukemia virus

Affiliations

Caveola-dependent endocytic entry of amphotropic murine leukemia virus

Christiane Beer et al. J Virol. 2005 Aug.

Abstract

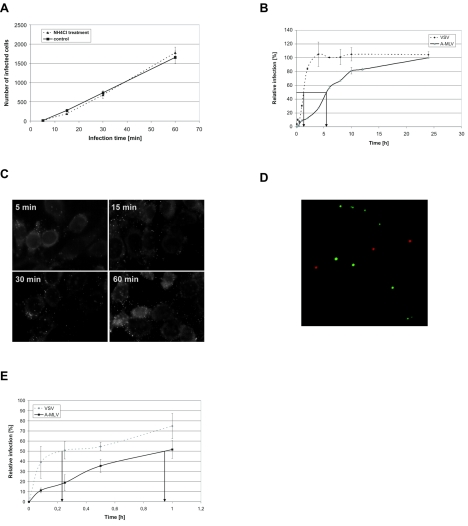
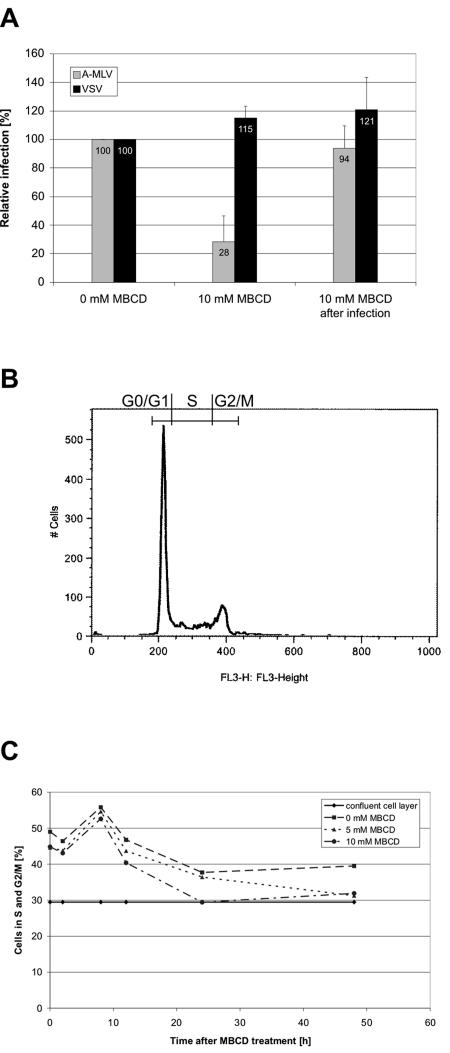
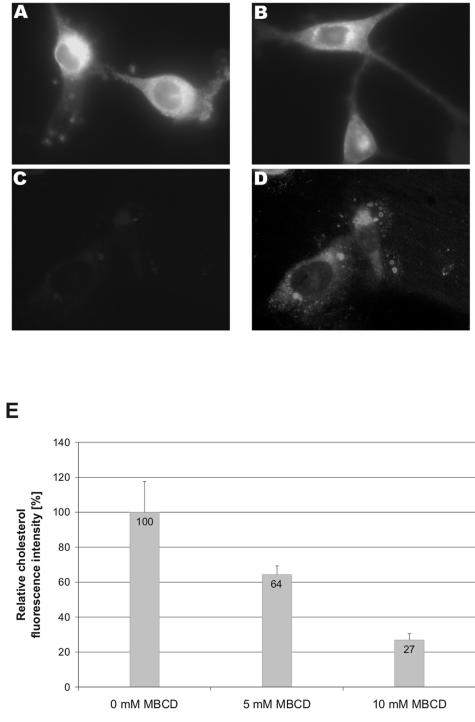
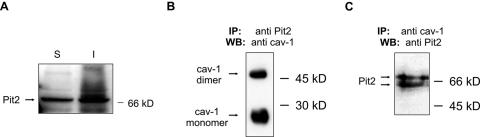
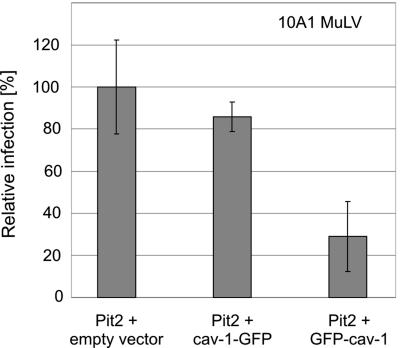
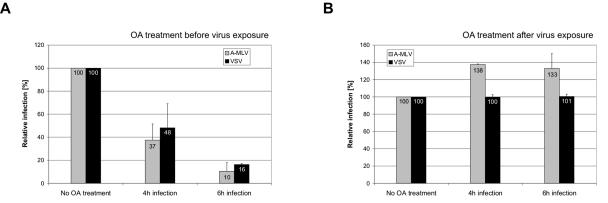
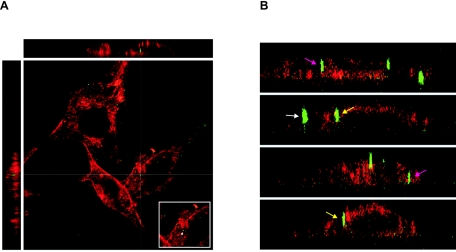
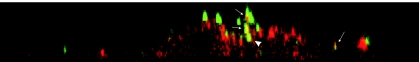
Early results suggested that the amphotropic murine leukemia virus (A-MLV) does not enter cells via endocytosis through clathrin-coated pits and this gammaretrovirus has therefore been anticipated to fuse directly with the plasma membrane. However, here we present data implicating a caveola-mediated endocytic entry route for A-MLV via its receptor Pit2. Caveolae belong to the cholesterol-rich microdomains characterized by resistance to nonionic detergents such as Triton X-100. Extraction of murine fibroblastic NIH 3T3 cells in cold Triton X-100 showed the presence of the A-MLV receptor Pit2 in detergent-insoluble microdomains. Using coimmunoprecipitation of cell extracts, we were able to demonstrate direct association of Pit2 with caveolin-1, the structural protein of caveolae. Other investigations revealed that A-MLV infection in contrast to vesicular stomatitis virus infection is a slow process (t(1/2) approximately 5 h), which is dependent on plasma membrane cholesterol but independent of NH4Cl treatment of cells; NH4Cl impairs entry via clathrin-coated pits. Furthermore, expression of dominant-negative caveolin-1 decreased the susceptibility to infection via Pit2 by approximately 70%. These results show that A-MLV can enter cells via a caveola-dependent entry route. Moreover, increase in A-MLV infection by treatment with okadaic acid as well as entry of fusion-defective fluorescent A-MLV virions in NIH 3T3 cells further confirmed our findings and show that A-MLV can enter mouse fibroblasts via an endocytic entry route involving caveolae. Finally, we also found colocalization of fusion-defective fluorescent A-MLV virions with caveolin-1 in NIH 3T3 cells. This is the first time substantial evidence has been presented implicating the existence of a caveola-dependent endocytic entry pathway for a retrovirus.


Figures

FIG. 1.
FIG. 1.
Infection of NIH 3T3 is a slow pH-independent process. (A) NH4Cl treatment has no effect on A-MLV infection. NIH 3T3 cells were treated with 50 mM NH4Cl for 30 min, washed, and incubated with A-MLV pseudotyped vectors. At the indicated time points, noninternalized viruses were inactivated using citrate buffer. Forty-eight hours after vector addition, infected β-galactosidase-positive cells were counted. Shown is one representative experiment done in triplicate. Similar results were obtained in another independent experiment. (B) Infection kinetics of A-MLV and VSV pseudotyped vectors. NIH 3T3 cells were exposed to A-MLV or VSV pseudotyped vectors and at the indicated time points, noninternalized viruses were inactivated using citrate buffer. Forty-eight hours after vector addition, infected β-galactosidase-positive cells were counted. The number of infected cells is normalized to the 24-h value. Shown is one representative experiment done in duplicate. Similar results were obtained in a second independent experiment. (C) Binding kinetics of fluorescently labeled A-MLV. NIH 3T3 cells were incubated with A-MLV particles containing a YFP-labeled nucleocapsid protein. At the indicated time points, cells were washed, fixed, and analyzed by fluorescence microscopy; particles not in focus in the cell cultures can appear larger than a single particle. Pictures were taken with an oil-immersion objective (original magnification, 1,000×). (D) Size comparison of fluorescent A-MLV with 110-nm fluorescent beads. A-MLV and 110-nm Texas Red-labeled beads were bound to chamber slides in the presence of Polybrene. After fixation with paraformaldehyde, pictures were taken with an oil-immersion objective (original magnification, 1,000×). (E) Entry kinetic of A-MLV and VSV. A-MLV or VSV pseudotypes were bound to MDTF cells at 4°C, the cells were washed to remove unbound virus, incubated at 37°C, and at the indicated time points, noninternalized viruses were inactivated using citrate buffer. Forty-eight hours after vector addition, infected β-galactosidase-positive cells were counted. The number of infected cells is normalized to the 24-h value. Values are the average of two independent experiments done in duplicate.
FIG. 2.
FIG. 2.
MBCD treatment of NIH 3T3 cells. (A) MBCD decreases the susceptibility of NIH 3T3 cells to A-MLV infection. NIH 3T3 cells were treated with 10 mM MBCD at 37°C for 15 min and infected for 2 h with A-MLV or VSV pseudotyped vectors. Noninternalized viruses were removed by citrate wash and 2 days after vector addition, infected β-galactosidase-positive cells and noninfected cells were counted and the percentages of infected cells was calculated. As a control, NIH 3T3 cells were infected for 2 h with A-MLV or VSV, washed with citrate buffer, and treated with 10 mM MBCD at 37°C for 15 min. The infection levels shown are normalized to the infection levels in the control cultures. Values are the average of two independent experiments done at least in triple; for A-MLV P values were ≤ 0.001 (MBCD treatment before infection) and >0.5 (MBCD treatment after infection), respectively, compared to mock-treated (0 mM MBCD) cultures. (B and C) Investigation of the effect of MBCD treatment on the cell cycle. NIH 3T3 cells were treated with 0 mM (mock), 5 mM,or 10 mM MBCD at 37°C for 15 min. The cells were washed and fresh DMEM containing 5% NCS was added. At 0, 2, 8, 12, 24, and 48 h after treatment, the cells were harvested and analyzed for their DNA amount using flow cytometry. (B) An example of a typical flow cytometry analysis is shown (0 mM MBCD, 2 h after treatment). (C) Fractions of cells in the S and G2/M phase of the cell cycle after MBCD treatment. At every time point is shown the fractions of cells in S and G2/M in mock-treated (0 mM MBCD) cultures and cultures treated with 5 mM and 10 mM MBCD. The straight line depicts the fraction of cells in S and G2/M in an NIH 3T3 cell culture exhibiting only slightly more cell-cell contacts than the 48 h mock- and MBCD-treated cultures to illustrate the proliferative state of the used NIH 3T3 cells in a nonmanipulated culture.
FIG. 3.
FIG. 3.
Effect of MBCD treatment on the plasma membrane cholesterol level of NIH 3T3 cells. NIH 3T3 cells were treated with (A) 0 mM (mock), (B) 5 mM, or (C and D) 10 mM MBCD at 37°C for 15 min. After this treatment, the cells were fixed and stained with 50 μg/ml filipin for 1 h. Pictures were all taken with an oil-immersion objective (original magnification, 1,000×) using the same camera settings. (A to C) Unprocessed pictures; (D) copy of the picture in C, which has been processed in Adobe Photoshop to visualize the presence of the cells. (E) Quantification of cholesterol extraction. Pictures of mock (0 mM) and MBCD-treated NIH 3T3 cells were analyzed for their fluorescently labeled cholesterol. The cholesterol levels shown are normalized to that of mock-treated cells. At least six randomly taken pictures were measured.
FIG. 4.
FIG. 4.
Pit2 localization and interaction with caveolin-1. (A) Immunoblot analysis of Triton X-100 soluble (S) and insoluble (I) fractions for the presence of Pit2. NIH 3T3 cells were treated with 0.5% Triton X-100 for 1 min at 4°C. The supernatant containing the soluble fraction and the cell remnant-containing insoluble fraction, respectively, were separated by SDS-PAGE and analyzed by immunoblot for the presence of Pit2 proteins. Similar results were obtained using NIH 3T3 cells overexpressing human Pit2 (not shown). (B) Caveolin-1 coimmunoprecipitate with Pit2. NIH 3T3 cells overexpressing human Pit2 were lysed at room temperature in 1% Triton X-100 and lysates were immunoprecipitated with an anti-Pit2 antibody. The resulting immunoprecipitates were analyzed for the presence of caveolin-1 using SDS-PAGE and immunoblotting. (C) Pit2 coimmunoprecipitate with caveolin-1. NIH 3T3 cells overexpressing human Pit2 were lysed at room temperature in 1% Triton X-100 and lysates were immunoprecipitated with an anti-caveolin-1 antibody. The resulting immunoprecipitates were analyzed for the presence of Pit2 using SDS-PAGE and immunoblotting. IP, immunoprecitation; WB, Western blot (immunoblotting). The anti-Pit2 antibodies recognize both human and mice Pit2. When using an antibody to a multimembrane-spanning protein not harboring a caveolin-binding consensus sequence, no caveolin-1 was coimmunoprecipitated nor could the protein be detected in lysates immunoprecipitated with anti-caveolin-1 antibodies (not shown).
FIG. 5.
FIG. 5.
Retroviral entry via Pit2 is dependent on caveolin-1. CHO K1 cells were cotransfected with a Pit2 expressing plasmid (POJ74) and an empty vector, or cav-1-GFP or GFP-cav-1 expression plasmids as described in Materials and Methods. The following day, cells were exposed to 10A1 MLV pseudotyped vectors encoding β-galactosidase. The data shown represent the means of the number of blue cells from three independent transfections ± standard deviation (P = 0.356 and P = 0.011 comparing empty vector with cav-1-GFP and with GFP-cav-1, respectively). The number of blue cells per dish was normalized to the number of blue cells per dish cotransfected with POJ74 and the empty expression vector. No blue cells were detected in mock-transfected (empty vectors) cells (data not shown).
FIG. 6.
FIG. 6.
Effect of okadaic acid on A-MLV and VSV infection. (A) NIH 3T3 cells were treated with 0.1 μM okadaic acid (OA) for 30 min. Subsequently, the cells were infected with A-MLV or VSV pseudotyped vectors for 4 and 6 h in the presence of okadaic acid. Noninternalized viruses were inactivated using citrate buffer and 48 h after vector addition, infected β-galactosidase-positive cells were counted. The numbers of infected cells are normalized to the mock values. Shown are the means of three (A-MLV) or two (VSV) independent experiments done in duplicate. (B) NIH 3T3 cells were incubated with A-MLV or VSV pseudotyped vectors for 4 or 6 h, washed, and treated with 0.1 μM okadaic acid for 30 min. Subsequently, noninternalized viruses were inactivated using citrate buffer and 48 h after vector addition, infected β-galactosidase-positive cells were counted. The numbers of infected cells are normalized to the mock values. Shown are the means of two independent experiments done in duplicate.
FIG. 7.
FIG. 7.
Fusion-defective Gag-YFP A-MLV particles can enter NIH 3T3 mouse fibroblasts. (A and B) NIH 3T3 cells were incubated for 6 h with Gag-YFP A-MLV particles (green), which are fusion defective due to an unprocessed envelope protein. The cells were washed with citrate buffer and fixed with paraformaldehyde, and the plasma membrane was stained using rhodamine-labeled concanavalin A (red). The cells were investigated for the presence of intracellular fluorescent viral particles via three-dimensional scanning confocal microscopy. Shown are the YZ (left) and XZ (top) sections with the corresponding XY section. The insert in A shows the virus particle (arrow) at the XY cross-section. (B) XZ and YZ sections. Pink arrows: intracellular particles; yellow arrows: membrane-associated particles; white arrow: extracellular cell-bound particle.
FIG. 8.
FIG. 8.
Colocalization of fusion-defective Gag-YFP A-MLV particles with caveolin-1 in NIH 3T3 cells. NIH 3T3 cells were incubated for 6 h with Gag-YFP A-MLV particles (green), which are fusion defective due to an unprocessed envelope protein. The cells were permeabilized, fixed with paraformaldehyde, and stained for caveolin-1 (red). The cells were investigated using three-dimensional scanning confocal microscopy. Shown is one example of a YZ section showing colocalization of Gag-YFP A-MLV with caveolin-1. Arrows: Gag-YFP A-MLV particles colocalized with caveolin-1. Arrowhead: intracellular Gag-YFP A-MLV particle colocalized with caveolin-1.

References

    1. Anderson, H. A., Y. Chen, and L. C. Norkin. 1996. Bound simian virus 40 translocates to caveolin-enriched membrane domains, and its entry is inhibited by drugs that selectively disrupt caveolae. Mol. Biol. Cell 7:1825-1834. - PMC - PubMed
    1. Anderson, R. G. W. 1998. The caveolae membrane system. Annu. Rev. Biochem. 67:199-225. - PubMed
    1. Andrawiss, M., Y. Takeuchi, L. Hewlett, and M. Collins. 2003. Murine leukemia virus particle assembly quantitated by fluorescence microscopy: role of Gag-Gag interactions and membrane association. J. Virol. 77:11651-11660. - PMC - PubMed
    1. Bialojan, C., and A. Takai. 1988. Inhibitory effect of a marine-sponge toxin, okadaic acid, on protein phosphatases. Specificity and kinetics. Biochem. J. 256:283-290. - PMC - PubMed
    1. Bøttger, P., and L. Pedersen. 2004. The central half of Pit2 is not required for its function as a retroviral receptor. J. Virol. 78:9564-9567. - PMC - PubMed

Publication types

LinkOut - more resources