

Systematic review and meta-analysis of strategies for the diagnosis of suspected pulmonary embolism
- PMID: 16052017
- PMCID: PMC1181264
- DOI: 10.1136/bmj.331.7511.259
Systematic review and meta-analysis of strategies for the diagnosis of suspected pulmonary embolism
Abstract
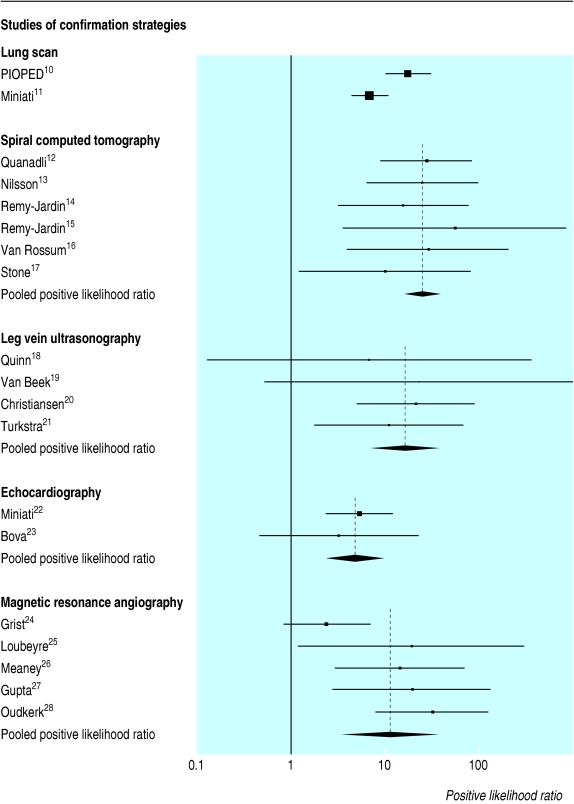
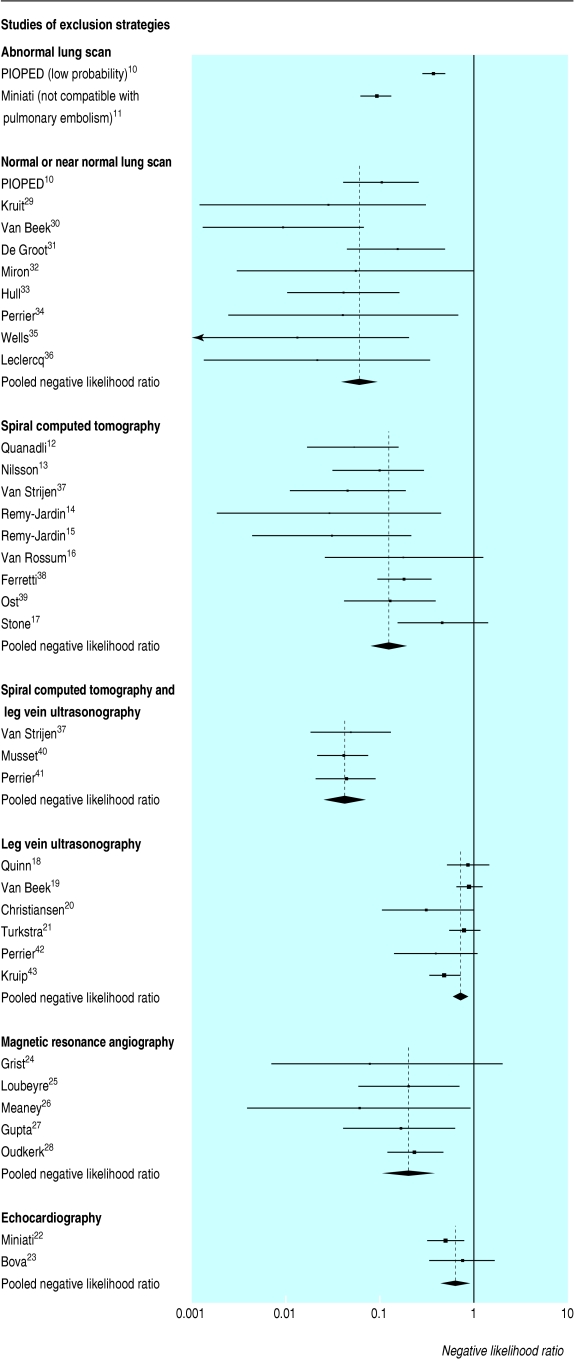
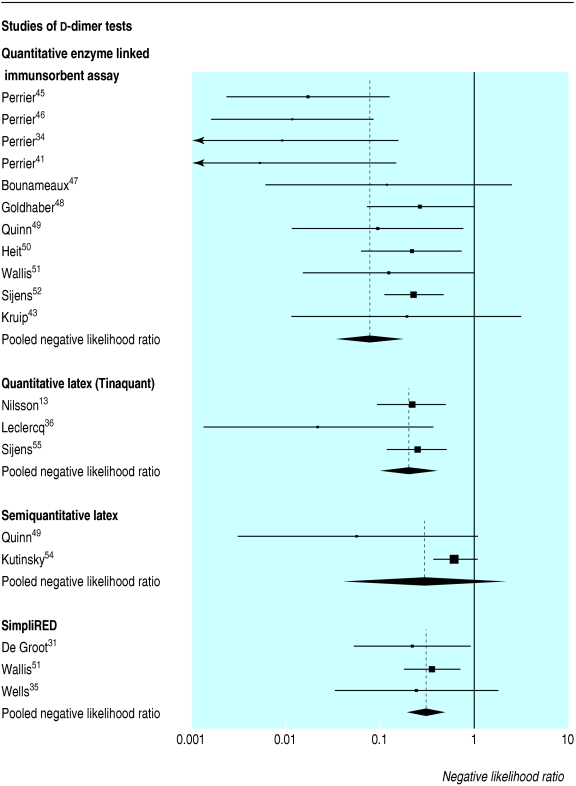
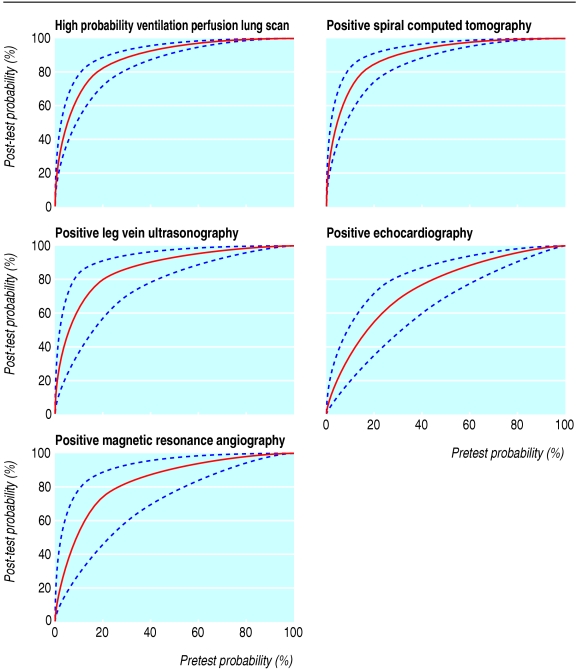
Objectives: To assess the likelihood ratios of diagnostic strategies for pulmonary embolism and to determine their clinical application according to pretest probability.
Data sources: Medline, Embase, and Pascal Biomed and manual search for articles published from January 1990 to September 2003.
Study selection: Studies that evaluated diagnostic tests for confirmation or exclusion of pulmonary embolism. DATA EXTRACTED: Positive likelihood ratios for strategies that confirmed a diagnosis of pulmonary embolism and negative likelihood ratios for diagnostic strategies that excluded a diagnosis of pulmonary embolism.
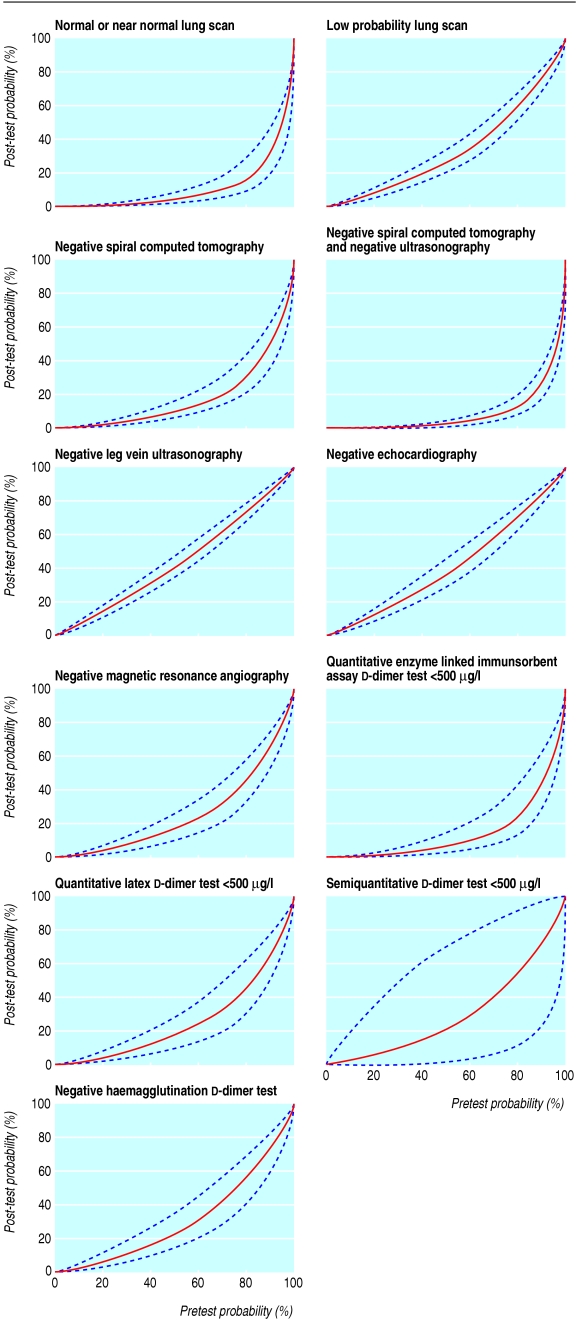
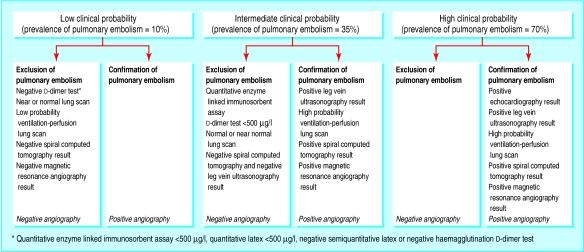
Data synthesis: 48 of 1012 articles were included. Positive likelihood ratios for diagnostic tests were: high probability ventilation perfusion lung scan 18.3 (95% confidence interval 10.3 to 32.5), spiral computed tomography 24.1 (12.4 to 46.7), and ultrasonography of leg veins 16.2 (5.6 to 46.7). In patients with a moderate or high pretest probability, these findings are associated with a greater than 85% post-test probability of pulmonary embolism. Negative likelihood ratios were: normal or near normal appearance on lung scan 0.05 (0.03 to 0.10), a negative result on spiral computed tomography along with a negative result on ultrasonography 0.04 (0.03 to 0.06), and a d-dimer concentration < 500 mug/l measured by quantitative enzyme linked immunosorbent assay 0.08 (0.04 to 0.18). In patients with a low or moderate pretest probability, these findings were associated with a post-test probability of pulmonary embolism below 5%. Spiral computed tomography alone, a low probability ventilation perfusion lung scan, magnetic resonance angiography, a quantitative latex d-dimer test, and haemagglutination d-dimers had higher negative likelihood ratios and can therefore only exclude pulmonary embolism in patients with a low pretest probability.
Conclusions: The accuracy of tests for suspected pulmonary embolism varies greatly, but it is possible to estimate the range of pretest probabilities over which each test or strategy can confirm or rule out pulmonary embolism.
Figures
References
-
- Chunilal SD, Eikelboom JW, Attia J, Miniati M, Panju AA, Simel DL, et al. Does this patient have pulmonary embolism? JAMA 2003;290: 2849-58. - PubMed
-
- Fedullo PF, Tapson VF. Clinical practice. The evaluation of suspected pulmonary embolism. N Engl J Med 2003;349: 1247-56. - PubMed
-
- Agresti A, Coull BA. Order-restricted tests for stratified comparisons of binomial proportions. Biometrics 1996;52: 1103-11. - PubMed
-
- DerSimonian R. Meta-analysis in the design and monitoring of clinical trials. Stat Med 1996;15: 1237-52. - PubMed
Publication types
MeSH terms
Substances
LinkOut - more resources
Full Text Sources
Other Literature Sources
Medical