. 2005 Oct;89(4):2458-72.
doi: 10.1529/biophysj.105.062539. Epub 2005 Jul 29.

SNARE-driven, 25-millisecond vesicle fusion in vitro

Affiliations

SNARE-driven, 25-millisecond vesicle fusion in vitro

Tingting Liu et al. Biophys J. 2005 Oct.

Abstract

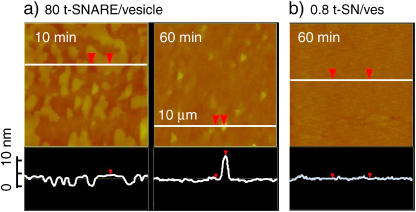
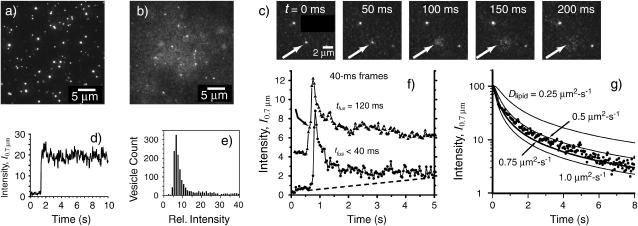
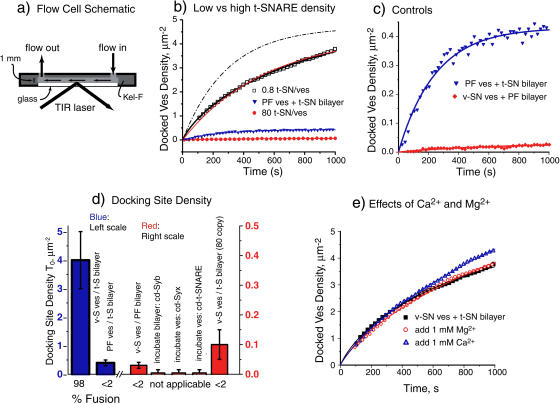
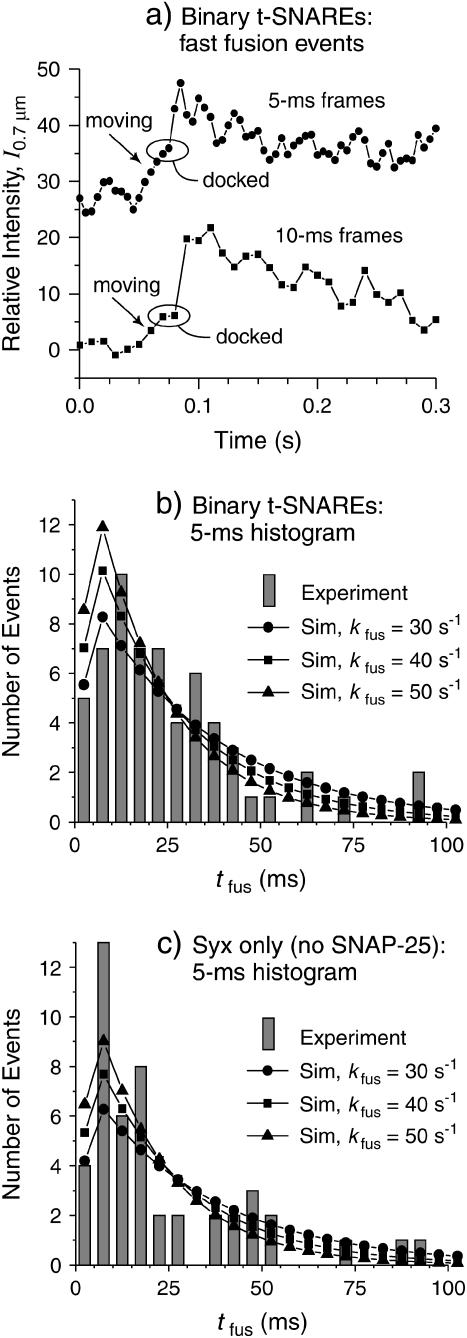
Docking and fusion of single proteoliposomes reconstituted with full-length v-SNAREs (synaptobrevin) into planar lipid bilayers containing binary t-SNAREs (anchored syntaxin associated with SNAP25) was observed in real time by wide-field fluorescence microscopy. This enabled separate measurement of the docking rate k(dock) and the unimolecular fusion rate k(fus). On low t-SNARE-density bilayers at 37 degrees C, docking is efficient: k(dock) = 2.2 x 10(7) M(-1) s(-1), approximately 40% of the estimated diffusion limited rate. Full vesicle fusion is observed as a prompt increase in fluorescence intensity from labeled lipids, immediately followed by outward radial diffusion (D(lipid) = 0.6 microm2 s(-1)); approximately 80% of the docked vesicles fuse promptly as a homogeneous subpopulation with k(fus) = 40 +/- 15 s(-1) (tau(fus) = 25 ms). This is 10(3)-10(4) times faster than previous in vitro fusion assays. Complete lipid mixing occurs in <15 ms. Both the v-SNARE and the t-SNARE are necessary for efficient docking and fast fusion, but Ca2+ is not. Docking and fusion were quantitatively similar on syntaxin-only bilayers lacking SNAP25. At present, in vitro fusion driven by SNARE complexes alone remains approximately 40 times slower than the fastest, submillisecond presynaptic vesicle population response.


Figures

FIGURE 1
FIGURE 1
AFM images of t-SNARE bilayers. Tapping-mode AFM images of 10 μm × 10 μm patches of t-SNARE bilayer formed by deposition of vesicles on a hydrophilic glass substrate at T = 37°C. Relatively high regions are bright yellow, whereas relatively low regions are dark brown. Scans (10 μm) of apparent height along the white, horizontal lines are shown below each image (0–10 nm height scale at left). Red triangles are position markers not of interest here. (a) Deposited from vesicles with ∼80 t-SNARE copies on average at total lipid concentration 25 μM. Image at left (10-min incubation) shows ridges of lipid bilayer (yellow) with nominal height 4.3 nm above bare glass (brown). Image at right (60-min incubation) shows large regions of flat bilayer (brown). The bright yellow spots are evidently “mounds” of t-SNARE material that rise 5–10 nm above the bilayer surface and have lateral dimensions of ∼400 nm. (b) After 60-min incubation time with vesicles of ∼0.8, t-SNARE copies on average at total lipid concentration 25 μM. No mounds appear. The root mean-square vertical displacement is 0.3 nm, comparable to that of bare glass.
FIGURE 2
FIGURE 2
Fast fusion of v-SNARE vesicles on low t-SNARE-density bilayers. (a) Field of docked, protein-free vesicles 50 s after addition to a low t-SNARE-density bilayer. Sparse docking, but no fusion, has occurred. (b) Field of v-SNARE vesicles 50 s after addition to a low t-SNARE-density bilayer. The diffuse fluorescence is due to labeled lipids that have fused into the bilayer and dispersed. (c) Sequence of images spaced by 50 ms showing fusion of a v-SNARE vesicle and outward radial diffusion of the labeled lipids. (d) Relative integrated intensity in a circle of radius 0.7 μm, I0.7μm(t), for a docked but unfused vesicle (frame a) using 40-ms frames. (e) Histogram of relative integrated fluorescence intensities for docked, protein-free vesicles (frame a). (f) Two examples of I0.7μm (t) for vesicles that undergo fast fusion as in frame b. In the lower trace, fusion occurs within one camera frame of docking, followed by diffusion out of the circle on a ∼1-s timescale. In the upper trace, the vesicle docks and waits three frames (marked by arrow) before fusion. Dashed line shows rising baseline due to leakage of labeled lipids from surrounding fusion events into the circle of integration. (g) Log plot of I0.7μm (t) for a single, well-isolated vesicle (no rising baseline). Lines are calculated by integrating Eq. 1 from r = 0 to 0.7 μm at each time t for various values of the diffusion coefficient Dlipid as shown. Dlipid = 0.6 ± 0.1 μm2 s−1 best fits the data.
FIGURE 3
FIGURE 3
Docking kinetics. (a) Schematic of flow cell for vesicle docking kinetics experiments. (b) Plots of total surface density of docked vesicles versus time, whether fused or unfused (Materials and Methods). (□) v-SNARE vesicles on low t-SNARE-density bilayer. Red line is least-squares fit to simple adsorption model (Eq. 3), yielding kdock = 1.1 × 10⁷ M−1 s−1 and adsorption site density T0 = 4.4 μm−2. Black line is hand-adjusted best fit to the diffusion-adsorption model (see text and Supplementary Material), with kdock = 2.0 × 10⁷ M−1 s−1 and T0 = 4.7 μm−2. The values of Dves = 3.3 μm2 s−1 and V0 = 1.7 × 10⁻¹⁰ M were held fixed. The dot-dash line shows the prediction of the simple kinetics model (Eq. 3) using the same values of kdock and T0. (Red circles) v-SNARE vesicles on high t-SNARE-density bilayer. Best-fit value is T0 = 0.10 μm−2, 40 times lower than the effective site density on the low t-SNARE-density bilayer. (Blue triangles) Protein-free vesicles on low t-SNARE-density bilayer. These data are repeated in frame c to emphasize the change of vertical scale. (c) Docking of v-SNARE vesicles on low t-SNARE-density bilayers as in frame b for two controls. Note vertical scale change from frame b. Lines are best fits to the diffusion-adsorption model. (Blue inverted triangles) Protein-free vesicles on low t-SNARE-density bilayer; T0 = 0.4 μm−2. (Red circles) v-SNARE vesicles on protein-free bilayer; T0 = 0.03 μm−2. (See Table 1 for all fitting results.) (d) Summary of absolute docking site density for v-SNARE vesicles on low t-SNARE-density bilayer (leftmost bar) and for all controls as indicated. Blue bars refer to left-hand scale, red bars to right-hand scale. “v-SN ves” means v-SNARE vesicle; “t-SN” means binary t-SNARE; “PF” means protein-free. Preincubations of the binary t-SNARE bilayer with cytoplasmic domain syb, and of the v-SNARE vesicles with the cytoplasmic domain of syx and with the cytoplasmic domain of the binary t-SNARE as shown. (Below) Percent of fusion-active vesicles, defined as the number of vesicles that fuse in 4 s divided by the total number of vesicles that dock in 4 s. (e) Docking curves for v-SNARE vesicle on low t-SNARE-density bilayers with addition of 1 mM Mg2+ and Ca2+, compared with standard buffer as indicated.
FIGURE 4
FIGURE 4
Fast fusion kinetics. (a) Examples of integrated intensity in a 0.7-μm radius circle, I0.7μm (t), for fast-fusing vesicles obtained with 5-ms and 10-ms camera frames on binary t-SNARE bilayers. The points within ovals are frames in which the vesicle was stationary (docked) before fusion. In the 5-ms trace, the three points preceding the oval correspond to frames in which the vesicle visits the circle of integration but is not yet firmly docked. See text for details. (b) Histogram of tfus combining 62 events with tfus < 0.1 s taken from 10 movies on five different binary t-SNARE bilayers. “Sim” traces show the results of averaging an exponential decay with kfus as indicated over a uniform distribution of docking times relative to the camera frames, normalized to 62 total events. See text. (c) Histogram of tfus combining 47 events with tfus < 0.1 s taken from 11 movies on six different syx-only bilayers. “Sim” traces as in b but normalized to 47 total events.

References

    1. Katz, B. 1969. The Release of Neural Transmitter Substances. Charles C. Thomas, Springfield, IL.
    1. Augustine, G. J. 2001. How does calcium trigger neurotransmitter release? Curr. Opin. Neurobiol. 11:320–326. - PubMed
    1. Sollner, T. H. 2003. Regulated exocytosis and SNARE function (Review). Mol. Membr. Biol. 20:209–220. - PubMed
    1. Llinas, R., I. Z. Steinberg, and K. Walton. 1981. Relationship between presynaptic calcium current and postsynaptic potential in squid giant synapse. Biophys. J. 33:323–351. - PMC - PubMed
    1. Bai, J., and E. R. Chapman. 2004. The C2 domains of synaptotagmin—partners in exocytosis. Trends Biochem. Sci. 29:143–151. - PubMed

Publication types