

Transcriptional networks in the liver: hepatocyte nuclear factor 6 function is largely independent of Foxa2
- PMID: 16055718
- PMCID: PMC1190247
- DOI: 10.1128/MCB.25.16.7069-7077.2005
Transcriptional networks in the liver: hepatocyte nuclear factor 6 function is largely independent of Foxa2
Abstract
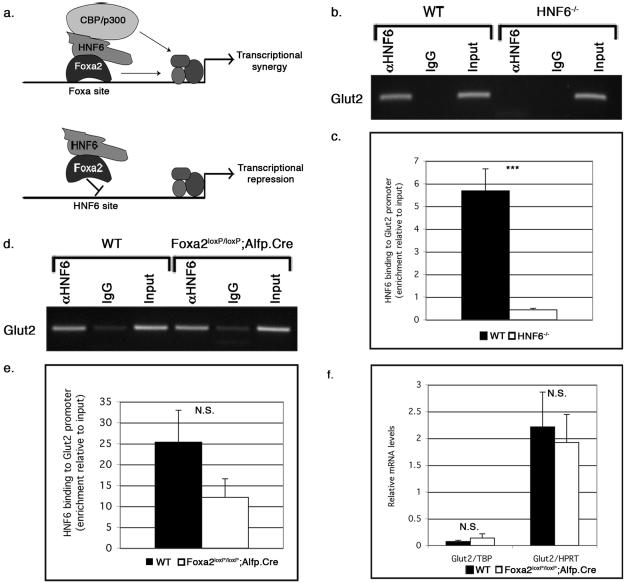
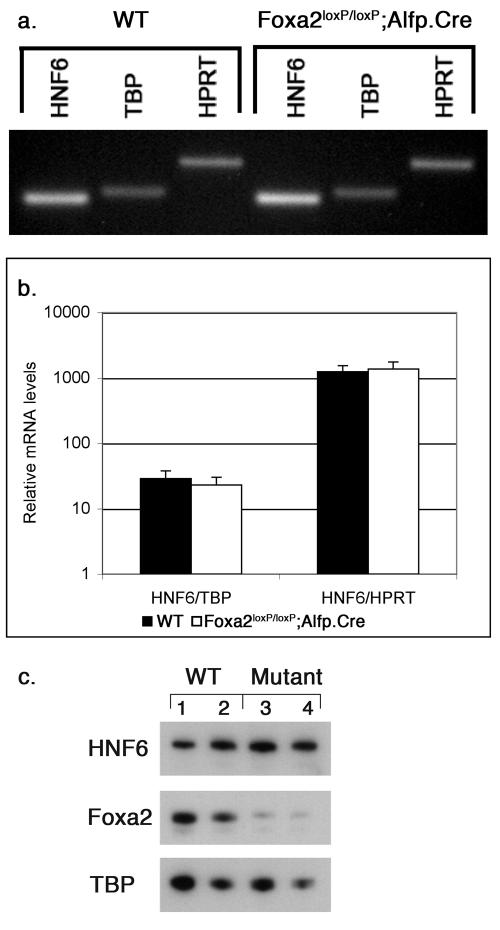
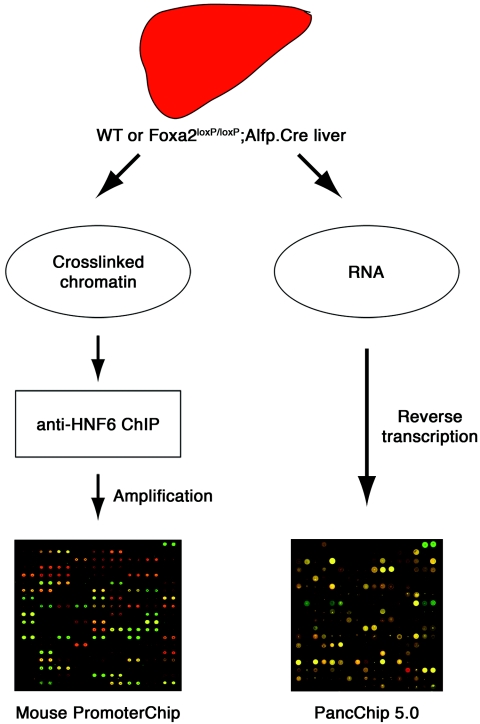
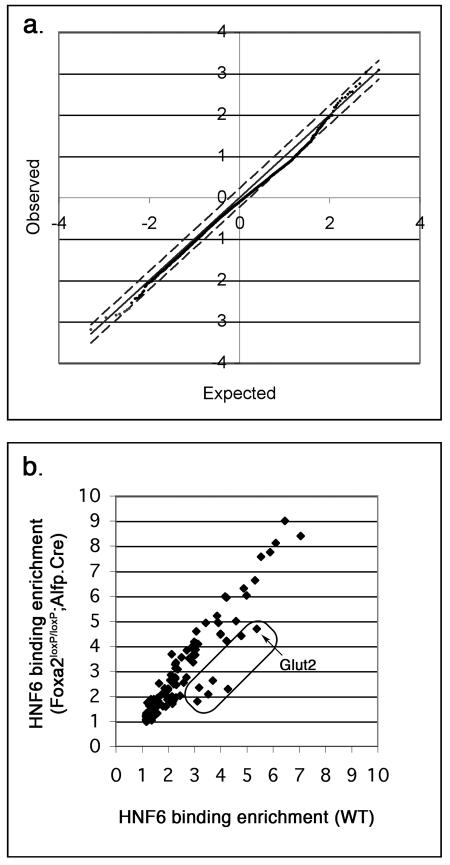
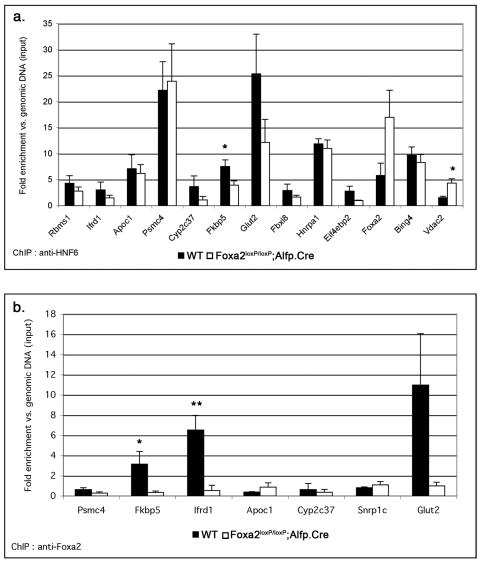
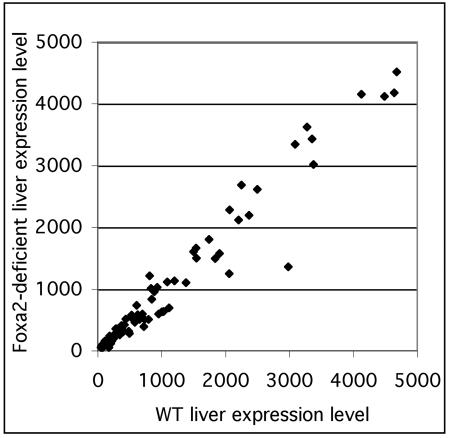
A complex network of hepatocyte nuclear transcription factors, including HNF6 and Foxa2, regulates the expression of liver-specific genes. The current model, based on in vitro studies, suggests that HNF6 and Foxa2 interact physically. This interaction is thought to synergistically stimulate Foxa2-dependent transcription through the recruitment of p300/CBP by HNF6 and to inhibit HNF6-mediated transcription due to the interference of Foxa2 with DNA binding by HNF6. To test this model in vivo, we utilized hepatocyte-specific gene ablation to study the binding of HNF6 to its targets in the absence of Foxa2. Chromatin immunoprecipitation using anti-HNF6 antibodies was performed on chromatin isolated from Foxa2(loxP/loxP) Alfp.Cre and control mouse livers, and HNF6 binding to its target, Glut2, was determined by quantitative PCR. In contrast to the current model, we found no significant difference in HNF6 occupancy at the Glut2 promoter between Foxa2-deficient and control livers. In order to evaluate the Foxa2/HNF6 interaction model on a global scale, we performed a location analysis using a microarray with 7,000 mouse promoter fragments. Again, we found no evidence that HNF6 binding to its targets in chromatin is reduced in the presence of Foxa2. We also examined the mRNA levels of HNF6 targets in the liver using a cDNA array and found that their expression was similar in Foxa2-deficient and control mice. Overall, our studies demonstrate that HNF6 binds to and regulates its target promoters in vivo in the presence and absence of Foxa2.
Figures
Similar articles
-
Stability of the hepatocyte nuclear factor 6 transcription factor requires acetylation by the CREB-binding protein coactivator.J Biol Chem. 2004 Oct 8;279(41):43070-6. doi: 10.1074/jbc.M407472200. Epub 2004 Aug 9. J Biol Chem. 2004. PMID: 15304484
-
Association between hepatocyte nuclear factor 6 (HNF-6) and FoxA2 DNA binding domains stimulates FoxA2 transcriptional activity but inhibits HNF-6 DNA binding.Mol Cell Biol. 2003 Jan;23(2):437-49. doi: 10.1128/MCB.23.2.437-449.2003. Mol Cell Biol. 2003. PMID: 12509444 Free PMC article.
-
C/EBPalpha and HNF6 protein complex formation stimulates HNF6-dependent transcription by CBP coactivator recruitment in HepG2 cells.Hepatology. 2006 Feb;43(2):276-86. doi: 10.1002/hep.21044. Hepatology. 2006. PMID: 16440369 Free PMC article.
-
Transcription factors in liver development, differentiation, and regeneration.Hepatology. 2003 Dec;38(6):1331-47. doi: 10.1016/j.hep.2003.09.034. Hepatology. 2003. PMID: 14647040 Review. No abstract available.
-
Does chasing selected 'Fox' to the nucleus prevent diabetes?Trends Mol Med. 2005 Jun;11(6):262-5. doi: 10.1016/j.molmed.2005.04.003. Trends Mol Med. 2005. PMID: 15949766 Review.
Cited by
-
Expansion of adult beta-cell mass in response to increased metabolic demand is dependent on HNF-4alpha.Genes Dev. 2007 Apr 1;21(7):756-69. doi: 10.1101/gad.1535507. Genes Dev. 2007. PMID: 17403778 Free PMC article.
-
Global analysis of in vivo Foxa2-binding sites in mouse adult liver using massively parallel sequencing.Nucleic Acids Res. 2008 Aug;36(14):4549-64. doi: 10.1093/nar/gkn382. Epub 2008 Jul 8. Nucleic Acids Res. 2008. PMID: 18611952 Free PMC article.
-
Foxa2-dependent hepatic gene regulatory networks depend on physiological state.Physiol Genomics. 2009 Jul 9;38(2):186-95. doi: 10.1152/physiolgenomics.90376.2008. Epub 2009 May 5. Physiol Genomics. 2009. PMID: 19417011 Free PMC article.
-
Notch Inhibition Enhances Cardiac Reprogramming by Increasing MEF2C Transcriptional Activity.Stem Cell Reports. 2017 Mar 14;8(3):548-560. doi: 10.1016/j.stemcr.2017.01.025. Epub 2017 Mar 2. Stem Cell Reports. 2017. PMID: 28262548 Free PMC article.
-
Regulation of the Pancreatic Exocrine Differentiation Program and Morphogenesis by Onecut 1/Hnf6.Cell Mol Gastroenterol Hepatol. 2019;7(4):841-856. doi: 10.1016/j.jcmgh.2019.02.004. Epub 2019 Mar 1. Cell Mol Gastroenterol Hepatol. 2019. PMID: 30831323 Free PMC article.
References
-
- Cereghini, S. 1996. Liver-enriched transcription factors and hepatocyte differentiation. FASEB J. 10:267-282. - PubMed
-
- Cirillo, L. A., F. R. Lin, I. Cuesta, D. Friedman, M. Jarnik, and K. S. Zaret. 2002. Opening of compacted chromatin by early developmental transcription factors HNF3 (FoxA) and GATA-4. Mol. Cell 9:279-289. - PubMed
-
- Clotman, F., V. J. Lannoy, M. Reber, S. Cereghini, D. Cassiman, P. Jacquemin, T. Roskams, G. G. Rousseau, and F. P. Lemaigre. 2002. The onecut transcription factor HNF6 is required for normal development of the biliary tract. Development 129:1819-1828. - PubMed
-
- Delesque-Touchard, N., S. H. Park, and D. J. Waxman. 2000. Synergistic action of hepatocyte nuclear factors 3 and 6 on CYP2C12 gene expression and suppression by growth hormone-activated STAT5b. Proposed model for female specific expression of CYP2C12 in adult rat liver. J. Biol. Chem. 275:34173-34182. - PubMed
Publication types
MeSH terms
Substances
Grants and funding
LinkOut - more resources
Full Text Sources
Other Literature Sources
Molecular Biology Databases
Miscellaneous