. 2005 Aug 1;202(3):371-7.
doi: 10.1084/jem.20050176.

CD28 costimulatory signal induces protein arginine methylation in T cells

Affiliations

CD28 costimulatory signal induces protein arginine methylation in T cells

Fabien Blanchet et al. J Exp Med. .

Abstract

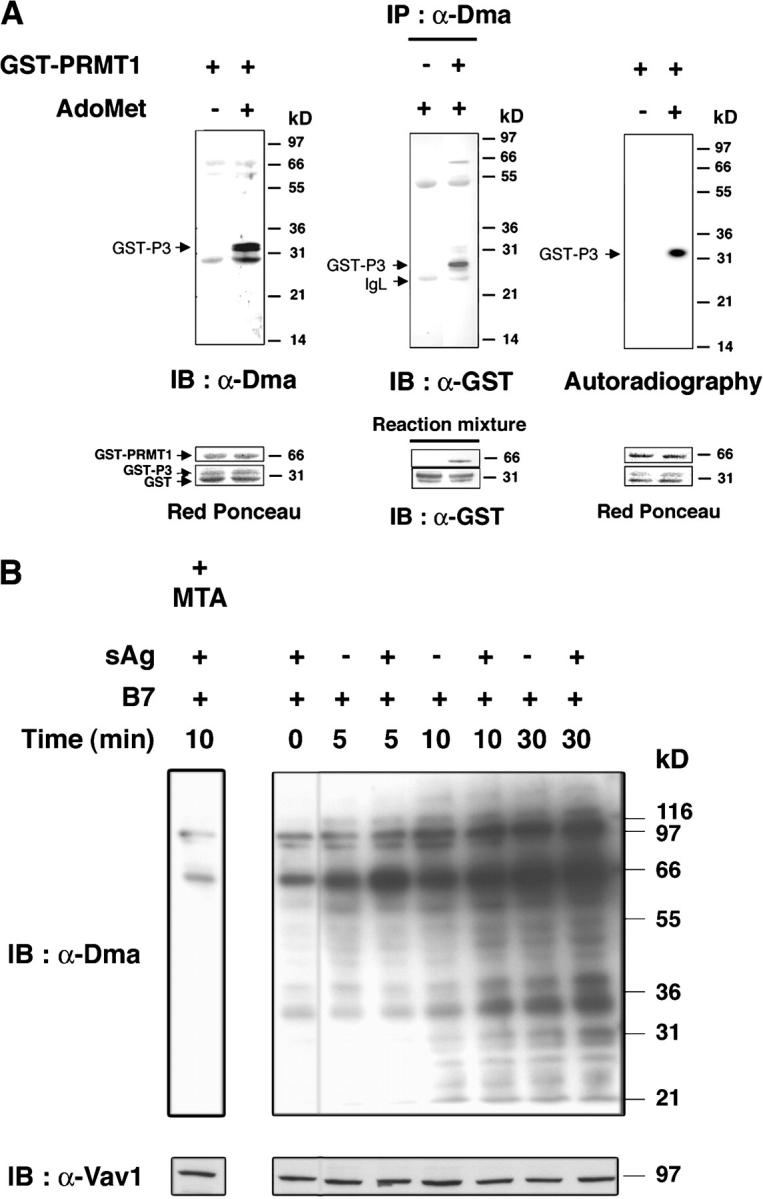
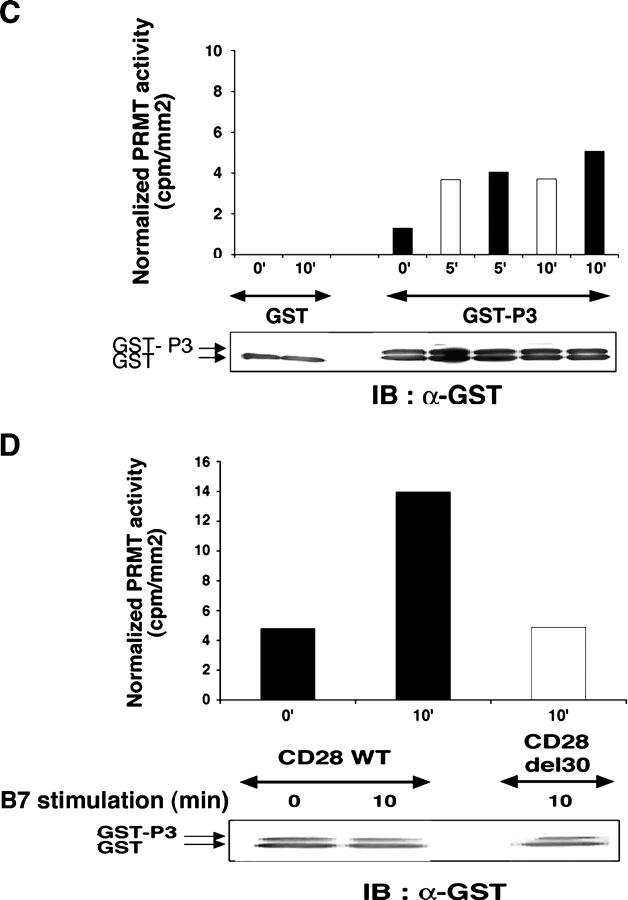
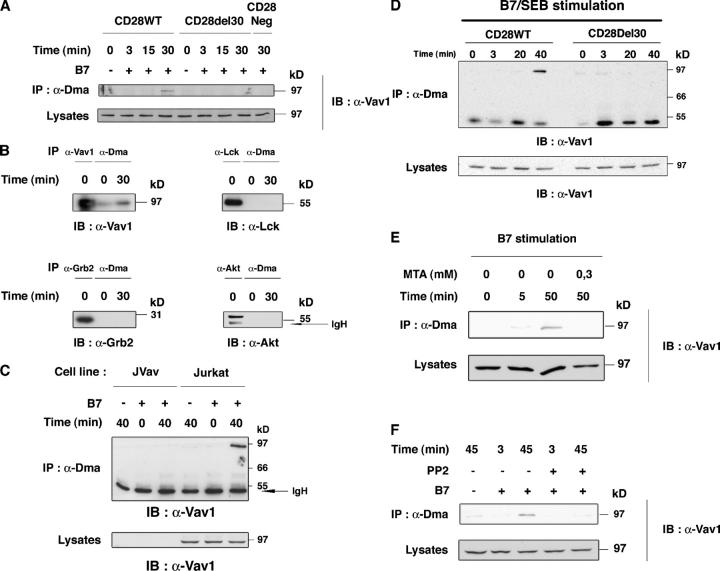
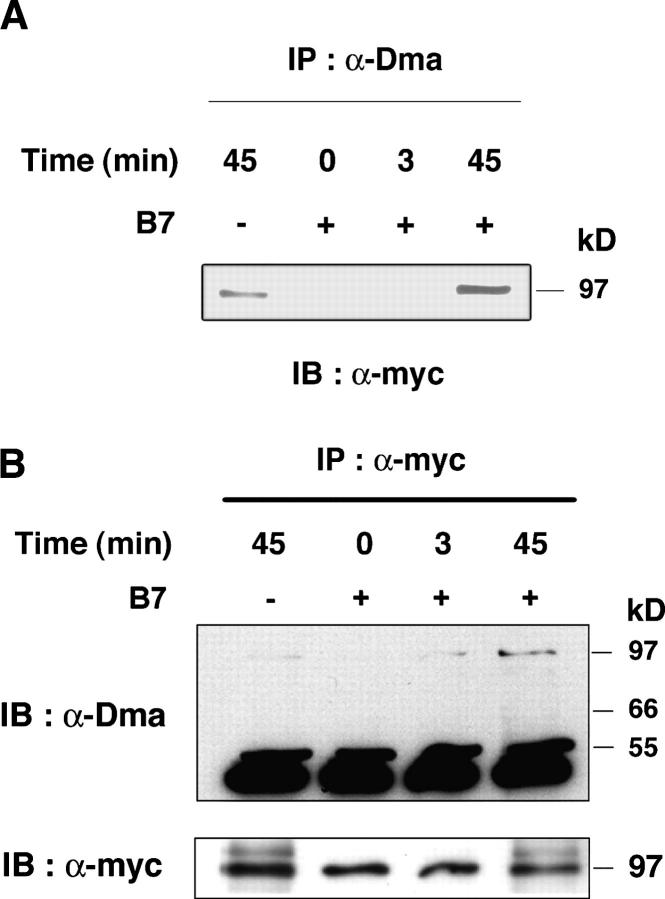
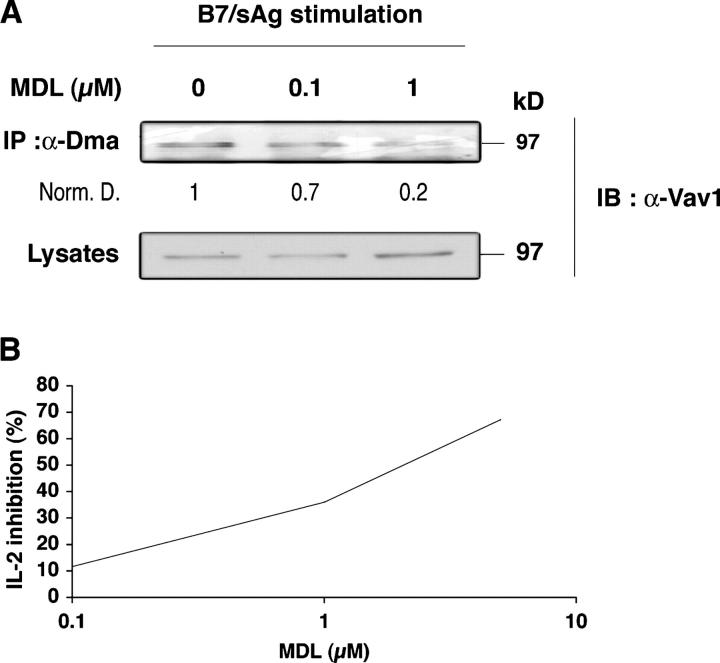
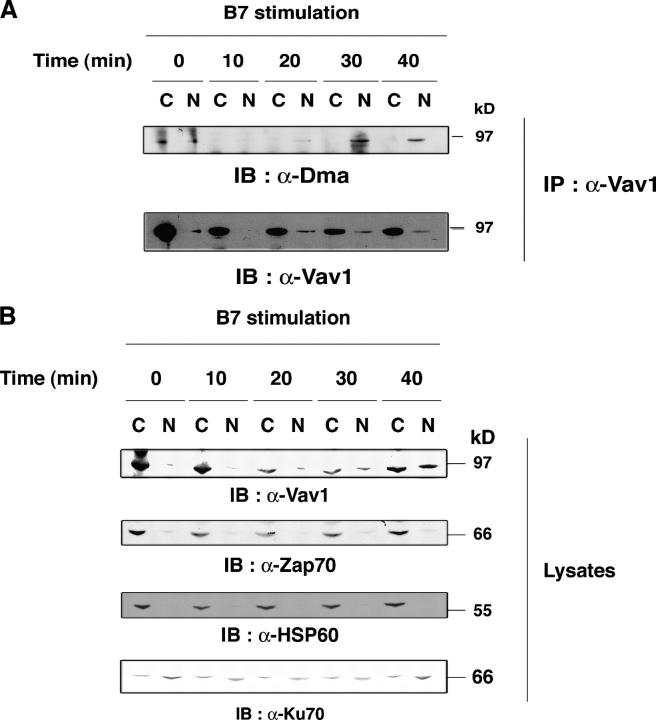
Protein phosphorylation initiates signal transduction that triggers lymphocyte activation. However, other posttranslational modifications may contribute to this process. Here, we show that CD28 engagement induced protein arginine methyltransferase activity and methylation on arginine of several proteins, including Vav1. Methylation of Vav1 and IL-2 production were reduced by inhibiting S-adenosyl-L-homocysteine hydrolase, an enzyme that regulates cellular transmethylation. Methylated Vav1 was induced in human and mouse T cells and selectively localized in the nucleus, which suggested that this form marks a nuclear function of Vav1. Our findings uncover a signaling pathway that is controlled by CD28 that is likely to be important for T cell activation.


Figures

Figure 1.
Figure 1.
T cell activation increases protein R-methylation and PRMT activity. (A) GST-P3 was reacted with or without AdoMet and GST-PRMT1 (left), or with or without GST-PRMT1 and AdoMet (middle; see Materials and methods) and immunoblotted with α-Dma antibody (left), or immunoprecipitated by α-Dma antibody and then immunoblotted with α-GST antibody (middle). PRMT1-dependent 3H incorporation in P3 in the presence of [3H]-AdoMet (right). Incubation, SDS-PAGE, and blotting were as in the left panel. The apparent discrepancy in migration of GST-P3 between the immunoprecipitate and reaction mixture (middle) was due to the use of NuPAGE Bis-Tris/MOPS and Tris-glycine SDS-gels, respectively. No 3H was detected in GST. Control for reaction mixture is below each experiment. (B) 106 T cells stimulated with 2.5 × 10⁵ 5–3.1-B7 cells prepulsed or not with a sAg cocktail (1 μg/ml) for the indicated times as described in Materials and methods. Lysates were immunoblotted with α-Dma (top). Equal loading was controlled by α-Vav1 (bottom). MTA was 0.3 mM for 1 h before stimulation. Shown is one representative of two experiments. (C) PRMT activity was assessed as in A (left) on a lysate of 2 × 10⁶ T cells stimulated as in B with 5–3.1-B7 cells prepulsed (white bars) or not (black bars) with sAg. Substrate content (GST-P3 arrow, bottom) was controlled by α-GST, quantified to normalize radioactivity content (cpm/mm2) associated GST-P3. (D) PRMT activity was detected as in C in lysates of 1.5 × 10⁶ CD28WT (black bars) or CD28Del30 (white bars) cells stimulated 0 or 10 min with 5 × 10⁵ 5–3.1-B7 cells. Substrate content was quantified as in C. Data are representative of two experiments.
Figure 1.
Figure 1.
T cell activation increases protein R-methylation and PRMT activity. (A) GST-P3 was reacted with or without AdoMet and GST-PRMT1 (left), or with or without GST-PRMT1 and AdoMet (middle; see Materials and methods) and immunoblotted with α-Dma antibody (left), or immunoprecipitated by α-Dma antibody and then immunoblotted with α-GST antibody (middle). PRMT1-dependent 3H incorporation in P3 in the presence of [3H]-AdoMet (right). Incubation, SDS-PAGE, and blotting were as in the left panel. The apparent discrepancy in migration of GST-P3 between the immunoprecipitate and reaction mixture (middle) was due to the use of NuPAGE Bis-Tris/MOPS and Tris-glycine SDS-gels, respectively. No 3H was detected in GST. Control for reaction mixture is below each experiment. (B) 106 T cells stimulated with 2.5 × 10⁵ 5–3.1-B7 cells prepulsed or not with a sAg cocktail (1 μg/ml) for the indicated times as described in Materials and methods. Lysates were immunoblotted with α-Dma (top). Equal loading was controlled by α-Vav1 (bottom). MTA was 0.3 mM for 1 h before stimulation. Shown is one representative of two experiments. (C) PRMT activity was assessed as in A (left) on a lysate of 2 × 10⁶ T cells stimulated as in B with 5–3.1-B7 cells prepulsed (white bars) or not (black bars) with sAg. Substrate content (GST-P3 arrow, bottom) was controlled by α-GST, quantified to normalize radioactivity content (cpm/mm2) associated GST-P3. (D) PRMT activity was detected as in C in lysates of 1.5 × 10⁶ CD28WT (black bars) or CD28Del30 (white bars) cells stimulated 0 or 10 min with 5 × 10⁵ 5–3.1-B7 cells. Substrate content was quantified as in C. Data are representative of two experiments.
Figure 2.
Figure 2.
α-Dma detects Vav1 upon CD28 costimulation. (A) CD28WT, CD28Del30, and CD28Neg cells (1.5 × 10⁷) were stimulated with 0.5 × 10⁷ 5–3.1-B7 (+), or 5–3.1 (−) cells for the indicated times. Lysates were immunoprecipitated with α-Dma and immunoblotted with α-Vav1. Immunoblot for comparable protein content in lysates is shown (bottom). This is one representative of five independent experiments. (B) CD28WT cells were stimulated as in A for the indicated times. Lysates were immunoprecipitated with α-Dma in parallel with α−Vav1, α-Lck, α-Grb-2, and α-Akt antibodies. Immunoblots were with the indicated antibodies. (C) Vav1-deficient Jurkat cells (JVav) and Jurkat cells were stimulated with 5–3.1 or 5–3.1-B7 cells for the indicated times and lysates were treated as in A. Controls for Vav1 were done by α-Vav1 immunoblot (bottom). (D) CD28WT and CD28Del30 cell lines (1.5 × 10⁷) were stimulated with 0.5 μg/ml SEB prepulsed 5–3.1-B7 cells (0.5 × 10⁷) for the indicated times. Lysates were treated as in A and immunoblotted with α-Vav1. (bottom) Comparable Vav1 content in lysates. One experiment is shown of two giving similar results. (E) 2 × 10⁷ cultured T cells were pretreated for 1 h with 0.3 mM MTA before stimulation with 0.5 × 10⁷ 5–3.1-B7 cells. Cell lysates were reacted to α-Dma as in A, followed by α-Vav1 immunoblotting. Similar results were obtained in two experiments. (F) CD28WT cells treated with or without PP2 (10 μM) were stimulated for 3 or 45 min and processed as in A. 10 μM of PP2 strongly inhibited B7-induced Vav1 tyrosine phosphorylation (not depicted).
Figure 3.
Figure 3.
B7 induces R-methylation of Vav1. (A) 1.5 × 10⁷ T 8.1-Vav1 cells were stimulated with 0.5 × 10⁷ DAP3 (−), or DAP3-B7 (+) cells for the indicated times. Lysates that were immunoprecipitated with α-Dma were immunoblotted with α-myc antibody. (B) Same experiment as in A, but lysates were immunoprecipitated with α-myc and immunoblotted with α-Dma. Controls for Vav1 amounts in α-myc immunoprecipitates are shown (bottom). Comparable data were obtained in three other experiments.
Figure 4.
Figure 4.
MDL 28, 842 inhibits Vav1 R-methylation and IL-2 production. (A) 1.5 × 10⁷ CD28WT cells were pretreated for 1 h with 0.1 and 1 μM MDL and stimulated for 40 min with 0.5 × 10⁷ SEB-pulsed 5–3.1-B7 cells, as in Fig. 2 B. Lysates were processed, immunoprecipitated with α-Dma, and Vav1 was detected as in Fig. 2 B. Numbers indicate relative amounts of methylated Vav1 signal after normalization for protein (bottom). Similar results were obtained in two experiments. (B) 5 × 10⁵ CD28 WT cells (triplicates) were treated for 1 h with 0.1, 1, and 5 μM of MDL. After washing, they were stimulated for 3.5 h with 105 5–3.1-B7 cells pulsed with SEB (0.5 μg/ml). Brefeldin A (10 μg/ml) was added after 1 h of incubation. Cells were treated as described in Materials and methods for IL-2 FACS analysis. Similar results were obtained in four experiments.
Figure 5.
Figure 5.
R-methylated Vav1 localizes in the nuclear fraction. (A) CD28WT cells (107) stimulated with 0.3 × 10⁷ 5–3.1-B7 cells for the indicated times were processed to obtain cytosol (C) or nuclear (N) proteins. α-Vav1 immunoprecipitates from each fraction were immunoblotted with α-Dma (top). Vav1 content was controlled after stripping and reprobing with α-Vav1 (bottom). (B) 20 μg of C and N protein were loaded on SDS-PAGE and immunoblotted with indicated antibodies.

Similar articles

Cited by

References

    1. Acuto, O., and F. Michel. 2003. CD28-mediated co-stimulation: a quantitative support for TCR signalling. Nat. Rev. Immunol. 3:939–951. - PubMed
    1. Acuto, O., and D. Cantrell. 2000. T cell activation and the cytoskeleton. Annu. Rev. Immunol. 18:165–184. - PubMed
    1. McBride, A.E., and P.A. Silver. 2001. State of the arg: protein methylation at arginine comes of age. Cell. 106:5–8. - PubMed
    1. Boisvert, F.M., C.A. Chenard, and S. Richard. 2005. Protein interfaces in signaling regulated by arginine methylation. Sci. STKE. 2005:re2. - PubMed
    1. Ong, S.E., G. Mittler, and M. Mann. 2004. Identifying and quantifying in vivo methylation sites by heavy methyl SILAC. Nat. Methods. 1:116–126. - PubMed

Publication types

MeSH terms