

A three-dimensional model of myxobacterial aggregation by contact-mediated interactions
- PMID: 16061806
- PMCID: PMC1183571
- DOI: 10.1073/pnas.0504259102
A three-dimensional model of myxobacterial aggregation by contact-mediated interactions
Abstract
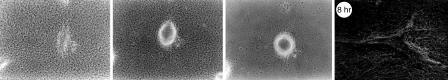
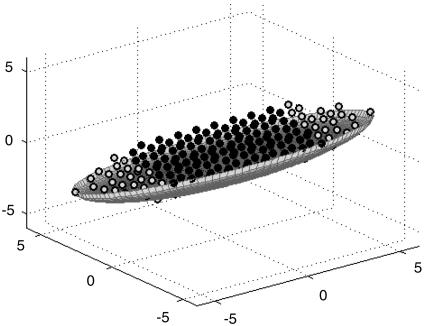
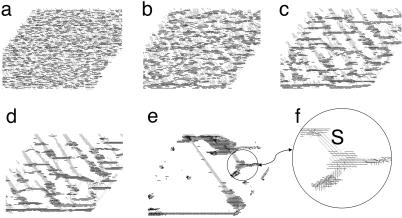
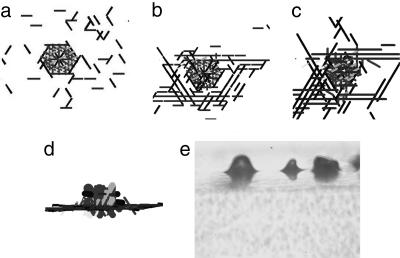
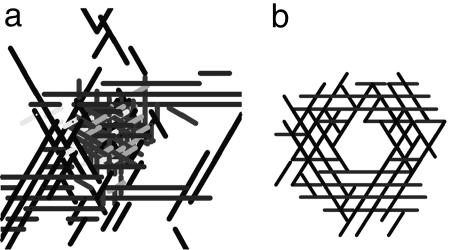
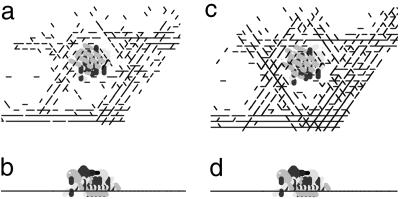
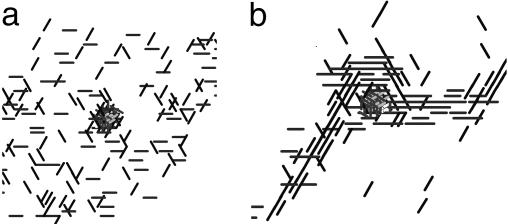
Myxobacteria provide one of the simplest models of cell-cell interaction and organized cell movement leading to cellular differentiation. When starved, tens of thousands of cells change their movement pattern from outward spreading to inward concentration; they form aggregates that become fruiting bodies. Cells inside fruiting bodies differentiate into round, nonmotile, environmentally resistant spores. Traditionally, cell aggregation has been considered to imply chemotaxis; a long-range cell interaction. However, myxobacterial aggregation is the consequence of direct cell-contact interactions, not chemotaxis. We present here a 3D stochastic lattice-gas cellular automata model of cell aggregation based on local cell-cell contact, and no chemotaxis. We demonstrate that a 3D discrete stochastic model can simulate two stages of cell aggregation. First, a "traffic jam" forms embedded in a field of motile cells. The jam then becomes an aggregation center that accumulates more cells. We show that, at high cell density, cells stream around the traffic jam, generating a 3D hemispherical mound. Later, when the nuclear traffic jam dissolves, the aggregation center becomes a 3D ring of streaming cells.
Figures
Similar articles
-
A three-dimensional model of myxobacterial fruiting-body formation.Proc Natl Acad Sci U S A. 2006 Nov 14;103(46):17255-9. doi: 10.1073/pnas.0605555103. Epub 2006 Nov 6. Proc Natl Acad Sci U S A. 2006. PMID: 17088558 Free PMC article.
-
Signaling in myxobacteria.Annu Rev Microbiol. 2004;58:75-98. doi: 10.1146/annurev.micro.58.030603.123620. Annu Rev Microbiol. 2004. PMID: 15487930 Review.
-
Myxococcus xanthus fruiting body morphology is important for spore recovery after exposure to environmental stress.Appl Environ Microbiol. 2024 Oct 23;90(10):e0166024. doi: 10.1128/aem.01660-24. Epub 2024 Oct 4. Appl Environ Microbiol. 2024. PMID: 39365039 Free PMC article.
-
Aggregation during fruiting body formation in Myxococcus xanthus is driven by reducing cell movement.J Bacteriol. 2007 Jan;189(2):611-9. doi: 10.1128/JB.01206-06. Epub 2006 Nov 10. J Bacteriol. 2007. PMID: 17098901 Free PMC article.
-
Myxobacterial tools for social interactions.Res Microbiol. 2012 Nov-Dec;163(9-10):579-91. doi: 10.1016/j.resmic.2012.10.022. Epub 2012 Nov 2. Res Microbiol. 2012. PMID: 23123306 Free PMC article. Review.
Cited by
-
Spatial organization of Myxococcus xanthus during fruiting body formation.J Bacteriol. 2007 Dec;189(24):9126-30. doi: 10.1128/JB.01008-07. Epub 2007 Oct 5. J Bacteriol. 2007. PMID: 17921303 Free PMC article.
-
Patterns of mesenchymal condensation in a multiscale, discrete stochastic model.PLoS Comput Biol. 2007 Apr 27;3(4):e76. doi: 10.1371/journal.pcbi.0030076. Epub 2007 Mar 8. PLoS Comput Biol. 2007. PMID: 17465675 Free PMC article.
-
Dual biochemical oscillators may control cellular reversals in Myxococcus xanthus.Biophys J. 2014 Dec 2;107(11):2700-11. doi: 10.1016/j.bpj.2014.09.046. Epub 2014 Dec 2. Biophys J. 2014. PMID: 25468349 Free PMC article.
-
A model of filamentous cyanobacteria leading to reticulate pattern formation.Life (Basel). 2014 Sep 3;4(3):433-56. doi: 10.3390/life4030433. Life (Basel). 2014. PMID: 25370380 Free PMC article.
-
A multiscale model of thrombus development.J R Soc Interface. 2008 Jul 6;5(24):705-22. doi: 10.1098/rsif.2007.1202. J R Soc Interface. 2008. PMID: 17925274 Free PMC article.
References
-
- Zhang, R., Pappas, T., Brace, J. L., Miller, P. C., Oulmassov, T., Molyneaux, J. M., Anderson, J. C., Bashkin, J. K., Winans, S. C. & Joachimiak, A. (2002) Nature 417, 971–974. - PubMed
-
- Igoshin, O. A., Kaiser, D. & Oster, G. (2004) Curr. Biol. 14, R459–R462. - PubMed
-
- Sproer, C., Reichenbach, H. & Stackebrandt, E. (1999) Int. J. Syst. Bacteriol. 49, 1255–1262. - PubMed
-
- Tsimring, L. & Levine, H. (1995) Phys. Rev. Lett. 75, 1859–1862. - PubMed
Publication types
MeSH terms
Grants and funding
LinkOut - more resources
Full Text Sources
