. 2005 Dec 1;392(Pt 2):353-62.
doi: 10.1042/BJ20050890.

The basal proton conductance of mitochondria depends on adenine nucleotide translocase content

Affiliations

The basal proton conductance of mitochondria depends on adenine nucleotide translocase content

Martin D Brand et al. Biochem J. .

Abstract

The basal proton conductance of mitochondria causes mild uncoupling and may be an important contributor to metabolic rate. The molecular nature of the proton-conductance pathway is unknown. We show that the proton conductance of muscle mitochondria from mice in which isoform 1 of the adenine nucleotide translocase has been ablated is half that of wild-type controls. Overexpression of the adenine nucleotide translocase encoded by the stress-sensitive B gene in Drosophila mitochondria increases proton conductance, and underexpression decreases it, even when the carrier is fully inhibited using carboxyatractylate. We conclude that half to two-thirds of the basal proton conductance of mitochondria is catalysed by the adenine nucleotide carrier, independently of its ATP/ADP exchange or fatty-acid-dependent proton-leak functions.


Figures
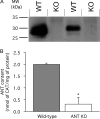
Figure 1
Figure 1. ANT content of skeletal-muscle mitochondria from wild-type and ANT1 knock-out mice
(A) Western blot of different preparations of mitochondria using polyclonal isotype-unspecific anti-ANT antibody. WT, wild-type; KO, ANT1 knock-out. (B) CAT titre of state-3 respiration rate to determine ANT content in mitochondria from wild-type and ANT1 knock-out mice (ANT KO). Replicate titrations were performed on each preparation and averaged. Values are mean and range or S.E.M. from two (control) or three (ANT KO) independent preparations. *P<0.05 compared with wild-type.
Figure 2
Figure 2. Respiration rates of skeletal-muscle mitochondria from wild-type and ANT1 knock-out (ANT KO) mice
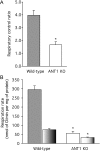
(A) Respiratory control ratios with 4 mM succinate as substrate (state-3 rate with 700 μM ADP added/state-4 rate). (B) Respiration rates in state 3 (solid bars) and state 4 (part-shaded bars). Replicate measurements were performed on each preparation and averaged. Values are means±S.E.M. from three independent preparations. *P<0.05 compared with wild-type in the same condition.
Figure 3
Figure 3. Proton leak of skeletal-muscle mitochondria from wild-type and ANT1 knock-out mice
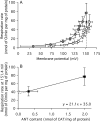
(A) Dependence of proton-leak rate (measured as the respiration rate driving proton leak in the presence of oligomycin) on membrane potential in mitochondria from wild-type () and ANT1 knockout (○) mice. The broken line indicates the highest common potential (151.4 mV). (B) Relationship between proton-leak rate at the highest common potential [measured as the respiration rate driving proton leak at 151.4 mV in (A)] and ANT content (from Figure 1B). Replicate measurements were performed on each preparation and averaged. Values are means±S.E.M. from three independent preparations. For the interpolated value of respiration (in B), the error shown is the weighted mean of the respiration-rate errors of the flanking experimental points in (A).
Figure 4
Figure 4. ANT content of mitochondria from Drosophila expressing different amounts of ANT
(A) CAT titre of respiration. State-3 respiration was titrated by successive additions of CAT to bring the mitochondria into a CAT-inhibited state 4. ANT content was measured as the CAT titre where the steepest slope in the titration crosses the state-4 rate (broken lines). Results of a single representative determination are shown for mitochondria from an ANT-overexpressing strain (▲), a wild-type strain () and an ANT-underexpressing strain (○). (B) ANT contents measured by CAT titre. Replicate titrations were performed on each preparation and averaged. Values are means±S.E.M. from 19 (mutants) or 21 (wild-type) independent preparations. *P<0.05 compared with wild-type.
Figure 5
Figure 5. Respiration rates of mitochondria from Drosophila expressing different amounts of ANT
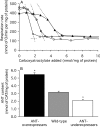
(A) Respiratory control ratios with 10 mM α-glycerol phosphate as substrate (state-3 rate with 1 mM ADP added/state-4 rate). (B) Respiration rates in state 3 (solid bars) and state 4 (part-shaded bars). Replicate measurements were performed on each preparation and averaged. Values are means±S.E.M. from 8 (ANT-overexpressers), 9 (wild-type) or 11 (ANT-underexpressers) independent preparations. *P<0.05 compared with wild-type in the same condition.
Figure 6
Figure 6. Proton leak of mitochondria from Drosophila expressing different amounts of ANT
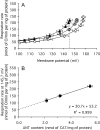
(A) Dependence of proton-leak rate (measured as the respiration rate driving proton leak in the presence of oligomycin) on membrane potential in mitochondria from ANT-overexpressers (▲), wild-type () and ANT-underexpressers (○). The broken line indicates the highest common potential (145.7 mV). (B) Relationship between proton-leak rate at the highest common potential [measured as the respiration rate driving proton leak at 145.7 mV in (A)] and ANT content (from Figure 4B). Replicate measurements were performed on each preparation and averaged. Values are means±S.E.M. from 26 (ANT-overexpressers and wild-type) or 23 (ANT-underexpressers) independent preparations. For the interpolated values of respiration (in B), the error shown is the weighted mean of the respiration-rate errors of the flanking experimental points in (A).
Figure 7
Figure 7. Effect of CAT on the proton leak of mitochondria from wild-type Drosophila
Dependence of proton-leak rate (measured as the respiration rate driving proton leak in the presence of oligomycin) on membrane potential in the absence () or presence () of 50 nmol of CAT/mg of mitochondrial protein. Replicate measurements were performed on each preparation and averaged. Values are means±S.E.M. from four independent preparations.
Figure 8
Figure 8. Proton leak of mitochondria from Drosophila expressing different amounts of ANT, in the absence and presence of excess CAT
Experiments were carried out on a small subset of the preparations used in Figure 6, using mitochondria from ANT-overexpressers (▲, control; ■, plus CAT), wild-type (, control; , plus CAT) and ANT-underexpressers (○, control; ◇, plus CAT). (A) Dependence of proton-leak rate on membrane potential in the absence of CAT. The broken line indicates the highest common potential (146.2 mV). (B) Relationship between proton-leak rate at the highest common potential in (A) and ANT content (from Figure 4B). (C) Dependence of proton-leak rate on membrane potential in the presence of 50 nmol of CAT/mg of protein. The broken line indicates the highest common potential (151.0 mV). (D) Relationship between proton-leak rate at the highest common potential in (C) and ANT content (from Figure 4B). Replicate measurements were performed on each preparation and averaged. Values are means±S.E.M. from four independent preparations. For the interpolated values of respiration in (B) and (D), the error shown is the weighted mean of the respiration-rate errors of the flanking experimental points in (A) and (C) respectively.
Figure 9
Figure 9. Effect of ANT content on the membrane phospholipid fatty acyl composition of Drosophila mitochondria
For details, see the Experimental section. Fatty acids are described as the ‘number of C atoms:number of double bonds (position of first double bond from the methyl end)’, thus C18:2(n−6) is linoleic acid. Values are means±S.E.M. from 11 (ANT-overexpressers, black bars; wild-type, dark grey bars) or six independent preparations (DC701 ANT-underexpressers, white bars; ras59 ANT-underexpressers, light-grey bars). *P<0.05 compared with wild type.
Figure 10
Figure 10. Correlation between proton conductance and ANT content in mammalian mitochondria
Mitochondria were isolated from liver (◆), skeletal muscle (■), heart (●) and kidney (▲) of the species indicated. The dependence of proton-leak rate (measured as the respiration rate driving proton leak in the presence of oligomycin) on membrane potential was determined as in Figure 3(A) and the interpolated rates at the highest common potential (120 mV) were calculated using mean data. Error bars represent the weighted mean of the respiration rate S.E.M. (or range when n=2) values of the flanking experimental points. ANT content was determined by CAT titre as in Figure 1(B); values are means±S.E.M. (or range when n=2). The numbers of independent preparations were one (mouse and horse tissues, and rat heart), two (pig tissues, rat liver and ox heart), three (ox liver, kidney and skeletal muscle) or four (rabbit tissues and rat skeletal muscle).

Similar articles

Cited by

References

    1. Brand M. D., Chien L. F., Ainscow E. K., Rolfe D. F. S., Porter R. K. The causes and functions of mitochondrial proton leak. Biochim. Biophys. Acta. 1994;1187:132–139. - PubMed
    1. Brand M. D. The proton leak across the mitochondrial inner membrane. Biochim. Biophys. Acta. 1990;1018:128–133. - PubMed
    1. Rolfe D. F. S., Brand M. D. Contribution of mitochondrial proton leak to skeletal muscle respiration and to standard metabolic rate. Am. J. Physiol. 1996;271:C1380–C1389. - PubMed
    1. Rolfe D. F. S., Brand M. D. The physiological significance of mitochondrial proton leak in animal cells and tissues. Biosci. Rep. 1997;17:9–16. - PubMed
    1. Rolfe D. F. S., Newman J. M., Buckingham J. A., Clark M. G., Brand M. D. Contribution of mitochondrial proton leak to respiration rate in working skeletal muscle and liver and to SMR. Am. J. Physiol. 1999;276:C692–C699. - PubMed

Publication types

MeSH terms