. 2005 Aug;15(8):1168-76.
doi: 10.1101/gr.3865305.

Region-specific detection of neuroblastoma loss of heterozygosity at multiple loci simultaneously using a SNP-based tag-array platform

Affiliations

Region-specific detection of neuroblastoma loss of heterozygosity at multiple loci simultaneously using a SNP-based tag-array platform

John M Maris et al. Genome Res. 2005 Aug.

Abstract

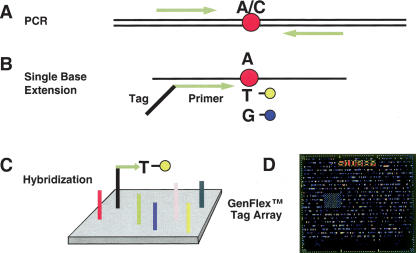
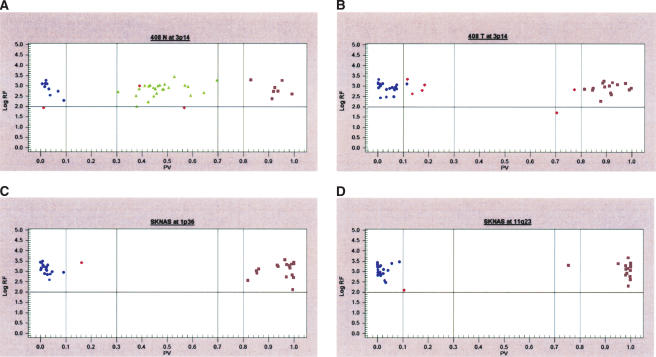
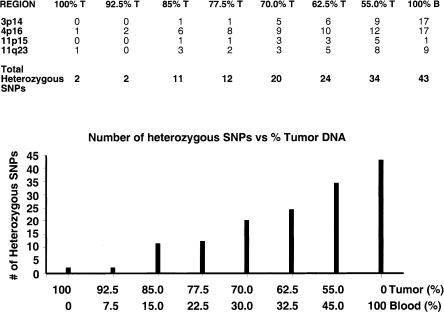
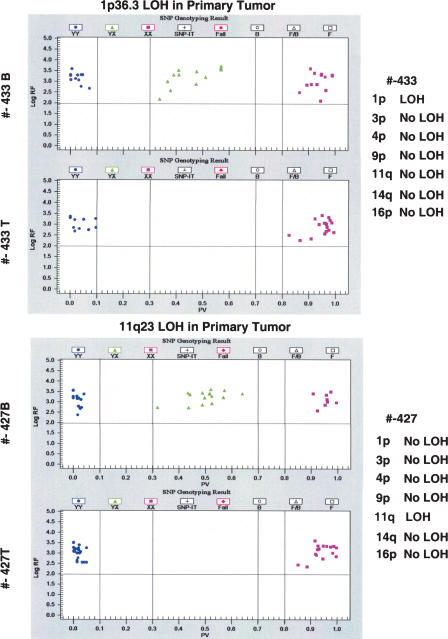
Many cancers are characterized by chromosomal aberrations that may be predictive of disease outcome. Human neuroblastomas are characterized by somatically acquired copy number changes, including loss of heterozygosity (LOH) at multiple chromosomal loci, and these aberrations are strongly associated with clinical phenotype including patient outcome. We developed a method to assess region-specific LOH by genotyping multiple SNPs simultaneously in DNA from tumor tissues. We identified informative SNPs at an average 293-kb density across nine regions of recurrent LOH in human neuroblastomas. We also identified SNPs in two copy number neutral regions, as well as two regions of copy number gain. SNPs were PCR-amplified in 12-plex reactions and used in solution-phase single-nucleotide extension incorporating tagged dideoxynucleotides. Each extension primer had 5' complementarity to one of 2000 oligonucleotides on a commercially available tag-array platform allowing for solid-phase sorting and identification of individual SNPs. This approach allowed for simultaneous detection of multiple regions of LOH in six human neuroblastoma-derived cell lines, and, more importantly, 14 human neuroblastoma primary tumors. Concordance with conventional genotyping was nearly absolute. Detection of LOH in this assay may not require comparison to matched normal DNAs because of the redundancy of informative SNPs in each region. The customized tag-array system for LOH detection described here is rapid, results in parallel assessment of multiple genomic alterations, and may speed identification of and/or assaying prognostically relevant DNA copy number alterations in many human cancers.


Figures

Figure 1.
Figure 1.
GenFlex Tag Array genotyping. The system consists of 2050 tag probe locations, designed to have approximately equal hybridization characteristics. (A) DNA encompassing each SNP is amplified with a set of primers and then (B) interrogated in a single-base extension reaction in solution with a primer attached to a tag complementary to a unique tag probe on the GenFlex Tag Array chip (C). Different alleles of a given SNP can be discriminated by use of sequence-specific dideoxynucleotides labeled with either fluorescein or biotin. The biotinylated positions are then labeled indirectly by reaction with streptavidin-conjugated phycoerythrin or SAPE after hybridization of the tag-SBE products to the tag probes. (D) Laser-induced emissions from the chips are then scanned at both 530 and 570 nm.
Figure 2.
Figure 2.
Cluster analysis of GenFlex Tag Array hybridization results. SNP calls are shown comparing (A) constitutional DNA to (B) primary tumor DNA from the same neuroblastoma sample and SK-N-AS cell line (C,D) DNA interrogating 1p36 and 11q23 regions both showing LOH. Blue circles and purple squares represent homozygous SNPs, while green triangles represent heterozygous SNPs. The X-axis represents the fraction of X allele signal [value = (X signal/(X + Y signals)], such that points near 1 represent XX homozygotes, those near 0 represent YY homozygotes, and points toward the middle XY heterozygotes. The software first uses a generic set of thresholds (the dashed vertical lines) to differentiate regions along the X-axis into each genotype cluster, leaving regions for potentially ambiguous data to remain as a “no call” (red data points). The Y-axis represents the log of the sum of both allele signals, leading to a confidence threshold or signal-to-noise cutoff (horizontal solid line), with points below this level representing “no call” data as well. The graphs show all of the SNP assays that were designed and attempted, thus although failed assay designs are still included in this data view, it is clear that several meaningful data points are gathered.
Figure 3.
Figure 3.
Quantitative allele frequency estimation based on analyses of mixed templates. (Upper panel) The number of heterozygous SNPs detected in mixtures containing varying amounts of the constitutional and tumor DNAs is shown with the number of heterozygous SNPs indicated in each of the four regions. (Bottom panel, bar-graph) The total number of heterozygous SNPs increases above that seen in tumor DNA (only two) when tumor DNA is contaminated with 15% normal (blood) DNA. The number increases linearly as the percentage of contaminating normal (blood) is increased to 45%.
Figure 4.
Figure 4.
Primary tumor data interrogating SNPs in the region of 1p and 11q23. Tumors 433 and 427 were interrogated for the seven commonly altered regions in neuroblastoma (NB) and compared to results from the corresponding constitutional DNAs. Blue circles and purple squares indicate homozygous SNPs, while green triangles indicate heterozygous SNPs. All heterozygous SNPs in the tumor sample, when compared to the normal sample, have been converted to hemizygous SNPs in both regions, thus showing LOH. Typing results (LOH/No LOH) for the seven different regions are listed on the far right.

References

    1. Bowman, L.C., Castleberry, R.P., Cantor, A., Joshi, V., Cohn, S.L., Smith, E.I., Yu, A., Brodeur, G.M., Hayes, F.A., and Look, A.T. 1997. Genetic staging of unresectable or metastatic neuroblastoma in infants: A Pediatric Oncology Group study. J. Natl. Cancer Inst. 89: 373–380. - PubMed
    1. Bown, N. 2001. Neuroblastoma tumour genetics: Clinical and biological aspects. J. Clin. Pathol. 54: 897–910. - PMC - PubMed
    1. Breen, C.J., O'Meara, A., McDermott, M., Mullarkey, M., and Stallings, R.L. 2000. Coordinate deletion of chromosome 3p and 11q in neuroblastoma detected by comparative genomic hybridization. Cancer Genet. Cytogenet. 120: 44–49. - PubMed
    1. Brodeur, G.M. 2003. Neuroblastoma: Biological insights into a clinical enigma. Nat. Rev. Cancer 3: 203–216. - PubMed
    1. Brodeur, G.M. and Maris, J.M. 2002. Neuroblastoma. In Principles and practice of pediatric oncology, 4th ed. (eds. P.A. Pizzo and D.G. Poplack), pp. 895–938. J.B. Lippincott Company, Philadelphia, PA.

Web site references

    1. http://snp.cshl.org; SNP Consortium Web interface.

Publication types

MeSH terms