. 2005 Jul-Aug;12(4):433-43.
doi: 10.1101/lm.96405.

Long-lasting modifications of saccadic eye movements following adaptation induced in the double-step target paradigm

Affiliations

Long-lasting modifications of saccadic eye movements following adaptation induced in the double-step target paradigm

Nadia Alahyane et al. Learn Mem. 2005 Jul-Aug.

Abstract

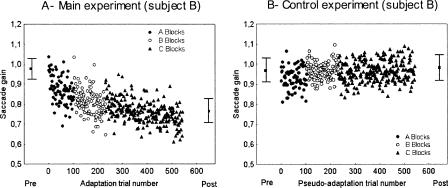
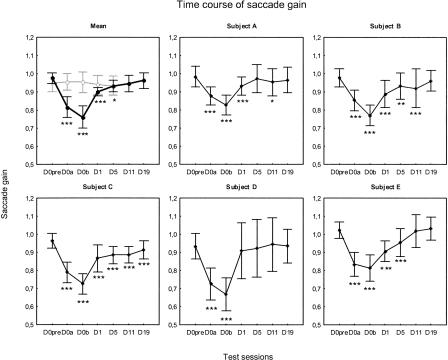
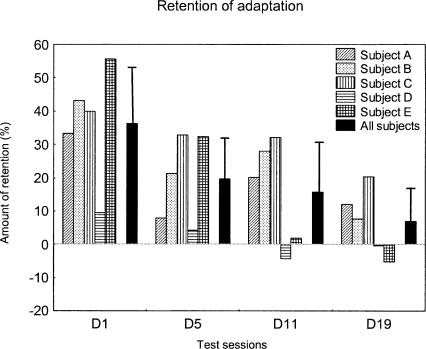
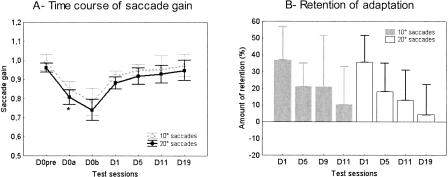
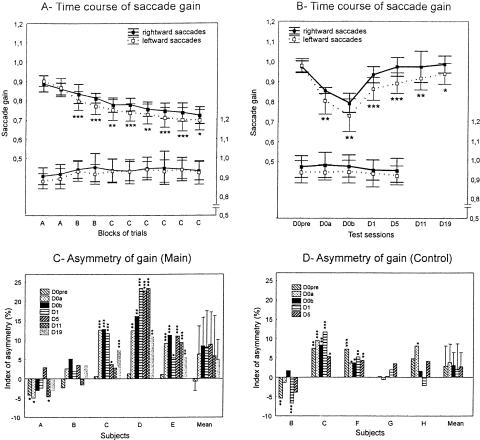
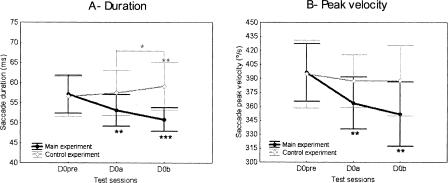
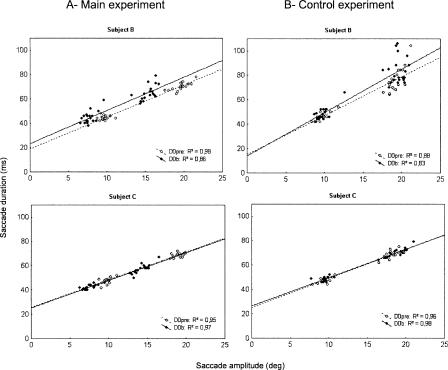
The adaptation of saccadic eye movements to environmental changes occurring throughout life is a good model of motor learning and motor memory. Numerous studies have analyzed the behavioral properties and neural substrate of oculomotor learning in short-term saccadic adaptation protocols, but to our knowledge, none have tested the persistence of the oculomotor memory. In the present study, the double-step target protocol was used in five human subjects to adaptively decrease the amplitude of reactive saccades triggered by a horizontally-stepping visual target. We tested the amplitude of visually guided saccades just before and at different times (up to 19 days) after the adaptation session. The results revealed that immediately after the adaptation session, saccade amplitude was significantly reduced by 22% on average. Although progressively recovering over days, this change in saccade gain was still statistically significant on days 1 and 5, with an average retention rate of 36% and 19%, respectively. On day 11, saccade amplitude no longer differed from the pre-adaptation value. Adaptation was more effective and more resistant to recovery for leftward saccades than for rightward ones. Lastly, modifications of saccade gain related to adaptation were accompanied by a decrease of both saccade duration and peak velocity. A control experiment indicated that all these findings were specifically related to the adaptation protocol, and further revealed that no change in the main sequence relationships could be specifically related to adaptation. We conclude that in humans, the modifications of saccade amplitude that quickly develop during a double-step target adaptation protocol can remain in memory for a much longer period of time, reflecting enduring plastic changes in the brain.


Figures

Figure 1.
Figure 1.
Time course of the saccade gain during the adaptation session of the main experiment (A) and during the pseudo-adaptation session of the control experiment (B) in subject B. The adaptation session consisted of three types of blocks of double-step trials differing in the amplitude of the intrasaccadic backward target step (step-2) relative to the first target step (step-1). They were presented in the following order: two A blocks (filled circles), then two B blocks (open circles), and finally six C blocks (filled triangles) (step-2 amplitude = 25%, 33%, and 40% respectively). The pseudo-adaptation contained the same successive blocks as in the adaptation session but without intrasaccadic target step (see Materials and Methods). The mean gain in pre-test session (Pre) and in the post-test session performed after completion of the entire adaptation or pseudo-adaptation session (Post) are also represented. Error bars, SD.
Figure 2.
Figure 2.
(Top left panel) Mean saccade gain plotted as a function of the test sessions of the main experiment (black line) and of the control experiment (gray line). These test sessions were conducted: (1) on day 0 before (D0pre), during (i.e., after nearly half of the trials; D0a), and immediately after completion of the adaptation (or pseudo-adaptation) session (D0b); (2) on days 1 (D1), 5 (D5); and (3), in the main experiment only, on days 11 (D11) and 19 (D19). The other panels show individual plots of all subjects (A through E) in the main experiment. Error bars, SD. Statistically significant differences of post-test saccade gain with respect to D0pre are indicated by *P < 0.05, **P < 0.01, and ***P < 0.001.
Figure 3.
Figure 3.
Percentage of retention of adaptation in the main experiment as a function of the test sessions, for each subject (n = 5) and for the subjects average (black bars). Error bars, SD.
Figure 4.
Figure 4.
(A) Mean saccade gain plotted separately for the 10° saccades (dashed gray line) and for the 20° saccades (black line) as a function of the test sessions of the main experiment (same format as in Fig. 2, “mean”). Error bars, SD. Statistically significant differences of saccade gain between the two types of saccades are shown by *P < 0.05. (B) Mean percentage of retention of adaptation in the main experiment (n = 5 subjects) plotted separately for the 10° (gray bars) and 20° (white bars) saccades as a function of the test sessions. Error bars, SD.
Figure 5.
Figure 5.
Effect of saccade direction. (A) The gain of rightward (solid line) and of leftward (dotted line) saccades is plotted as a function of the blocks of adaptation trials in the main experiment (upper trace and left y-axis) or of pseudo-adaptation trials in the control experiment (lower trace and right y-axis). (B) Mean saccade gain plotted separately for the rightward (solid trace) and leftward (dotted trace) direction as a function of the test sessions of the main experiment (upper trace and left y-axis; same format as in Figs. 2, 4A), and of the control experiment (lower trace and right y-axis). Error bars, SD. (C, D) The IA (%) of gain according to the saccade direction is plotted as a function of the test sessions for each subject (n = 5) and for the subjects' average, in the main experiment (C) and in the control experiment (D). Error bars, SD. In each panel, the asterisks indicate statistically significant differences of saccade gain between the two directions (*P < 0.05, **P < 0.01, and ***P < 0.001).
Figure 6.
Figure 6.
Duration (A) and peak velocity (B) of saccades recorded in the three test sessions on day 0 (D0pre, D0a, D0b) in the main experiment (black trace) and in the control experiment (gray trace). Error bars, SD. Statistically significant differences of saccade parameters between post-test sessions and the D0pre session or between the two post-tests are indicated by *P < 0.05, **P < 0.01, and ***P < 0.001.
Figure 7.
Figure 7.
Main sequence relationships for subjects B and C in the main experiment (A) and in the control experiment (B) at D0. Duration of saccades plotted as a function of their amplitude, in pre-test (open circles) and after the entire adaptation session D0b (filled circles). Each data point represents a saccade, the two directions of saccades being pooled together. Linear relationships represent best-fits through the pre-test (dotted line) and post-test (solid line) data.

References

    1. Abel, L.A., Schmidt, D., Dell'Osso, L.F., and Daroff, R.B. 1978. Saccadic system plasticity in humans. Ann. Neurol. 4: 313-318. - PubMed
    1. Abrams, R.A., Dobkin, R.S., and Helfrich, M.K. 1992. Adaptive modification of saccadic eye movements. J. Exp. Psychol. Hum. Percept. Perform. 18: 922-933. - PubMed
    1. Alahyane, N. and Pélisson, D. 2004. Eye position specificity of saccadic adaptation. IOVS 45: 123-130. - PubMed
    1. ———. 2005. Retention of saccadic eye movements. Ann. NY Acad. Sci. 1039: 558-562. - PubMed
    1. Alahyane, N., Koene, A., and Pélisson, D. 2004. Transfer of adaptation from visually-guided saccades to averaging saccades elicited by double visual targets. Eur. J. Neurosci. 20: 827-836. - PubMed

Publication types

LinkOut - more resources