. 2005 Aug;187(16):5537-51.
doi: 10.1128/JB.187.16.5537-5551.2005.

Evolution and molecular phylogeny of Listeria monocytogenes isolated from human and animal listeriosis cases and foods

Affiliations

Evolution and molecular phylogeny of Listeria monocytogenes isolated from human and animal listeriosis cases and foods

K K Nightingale et al. J Bacteriol. 2005 Aug.

Abstract

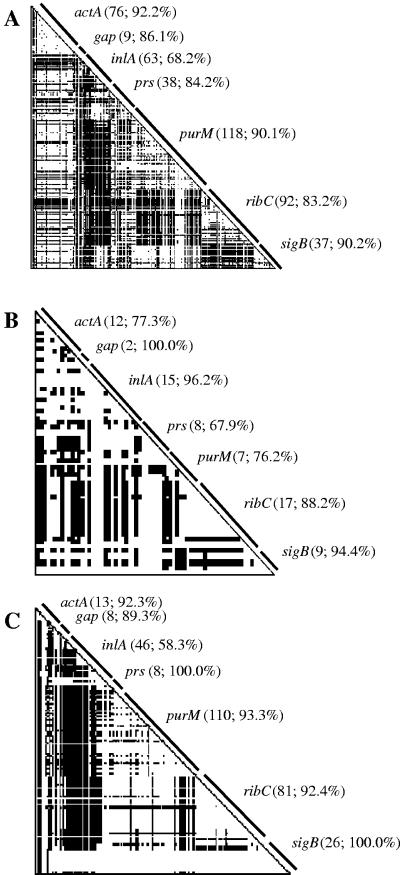
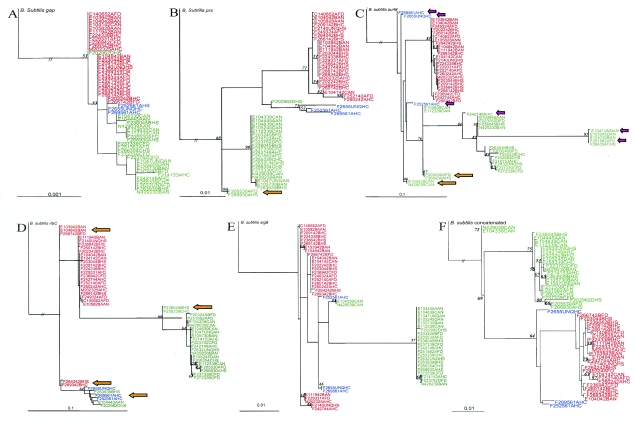
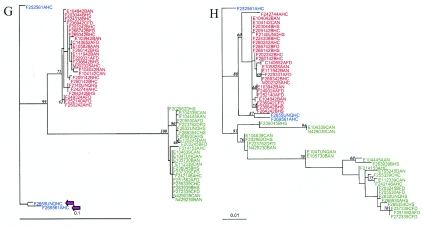
To probe the evolution and phylogeny of Listeria monocytogenes from defined host species and environments, L. monocytogenes isolates from human (n = 60) and animal (n = 30) listeriosis cases and food samples (n = 30) were randomly selected from a larger collection of isolates (n = 354) obtained in New York State between 1999 and 2001. Partial sequencing of four housekeeping genes (gap, prs, purM, and ribC), one stress response gene (sigB), and two virulence genes (actA and inlA) revealed between 11 (gap) and 33 (inlA) allelic types as well as 52 sequence types (unique combination of allelic types). actA, ribC, and purM demonstrated the highest levels of nucleotide diversity (pi > 0.05). actA and inlA as well as prs and the hypervariable housekeeping genes ribC and purM showed evidence of horizontal gene transfer and recombination. actA and inlA also showed evidence of positive selection at specific amino acid sites. Maximum likelihood phylogenies for all seven genes confirmed that L. monocytogenes contains two deeply separated evolutionary lineages. Lineage I was found to be highly clonal, while lineage II showed greater diversity and evidence of horizontal gene transfer. Allelic types were exclusive to lineages, except for a single gap allele, and nucleotide distance within lineages was much lower than that between lineages, suggesting that genetic exchange between lineages is rare. Our data show that (i) L. monocytogenes is a highly diverse species with at least two distinct phylogenetic lineages differing in their evolutionary history and population structure and (ii) horizontal gene transfer as well as positive selection contributed to the evolution of L. monocytogenes.


Figures

FIG. 1.
FIG. 1.
Compatibility matrices for nucleotide polymorphisms within (A) all L. monocytogenes isolates, (B) lineage I isolates only, and (C) lineage II isolates only. Matrices contain all possible pairwise comparisons of binary parsimony informative sites that are phylogenetically compatible (white cells) or incompatible (black cells) within genes (triangular regions) or between genes (rectangular regions). For each gene, values in parentheses are the number of informative sites followed by the observed within-gene compatibility.
FIG. 2.
FIG. 2.
Phylograms inferred by maximum likelihood methods for (A) gap, (B) prs, (C) purM, (D) ribC, (E) sigB, and (F) a concatenated sequence containing gap, prs, and sigB (a neighbor-joining phylogram for this concatenated sequence that also includes L. innocua is available as supplemental Fig. 1 (at http://www.foodscience.cornell.edu/wiedmann/Nightingale%20Supplementary.txt), as well as the virulence genes (G) actA and (H) inlA. Phylograms were constructed using one representative isolate for each sequence type. Taxon labels include the name (e.g., F2655, representing isolate FSL F2-655), ribotype (e.g., 44A represents DUP-1044A) and source (e.g., human isolate from NYSDOH [HS], human isolate from NYCDOH [HC], animal isolate [AN], and food isolate [FD]) for the representative isolate for each sequence type. Phylograms for gap, prs, purM, ribC, sigB, and the concatenated sequences for sigB, prs, and gap were rooted using Bacillus subtilis as an outgroup, while phylograms for actA and inlA were rooted using the three lineage III isolates in our data set as an outgroup. For some phylograms, the branch length of the outgroup was collapsed to best view the topology of the tree (collapsed branch length indicated by “//”). Maximum likelihood bootstrap support values (if >50) are shown as node labels. Genetic lineages assigned by EcoRI ribotyping are designated by different colors. Lineage I isolates (representing serotypes 1/2b [n = 32], 4b [n = 36], and 3b [n = 1]) are in red. Lineage II isolates (representing serotypes 1/2a [n = 43] and 1/2c [n = 4] as well one isolate that was untypeable [see supplemental Table 1]) are in green. Lineage III isolates (representing serotypes 4b [n = 1], 4a [n = 1] and one isolate that was untypeable [see supplemental Table 1]) are in blue. While lineage III isolates have previously been reported to predominantly represent serotypes 4a and 4c, recent data indicate that some lineage III isolates may also be serotype 4b (55). Large arrows indicate selected allelic types involved in recombination as identified by Sawyer's test (short purple and longer orange arrows indicate specific isolates and groups of isolates, respectively, involved in recombination); for inlA, allelic types involved in recombination were not identified due to the large number of recombination events in this gene.
FIG. 2.
FIG. 2.
Phylograms inferred by maximum likelihood methods for (A) gap, (B) prs, (C) purM, (D) ribC, (E) sigB, and (F) a concatenated sequence containing gap, prs, and sigB (a neighbor-joining phylogram for this concatenated sequence that also includes L. innocua is available as supplemental Fig. 1 (at http://www.foodscience.cornell.edu/wiedmann/Nightingale%20Supplementary.txt), as well as the virulence genes (G) actA and (H) inlA. Phylograms were constructed using one representative isolate for each sequence type. Taxon labels include the name (e.g., F2655, representing isolate FSL F2-655), ribotype (e.g., 44A represents DUP-1044A) and source (e.g., human isolate from NYSDOH [HS], human isolate from NYCDOH [HC], animal isolate [AN], and food isolate [FD]) for the representative isolate for each sequence type. Phylograms for gap, prs, purM, ribC, sigB, and the concatenated sequences for sigB, prs, and gap were rooted using Bacillus subtilis as an outgroup, while phylograms for actA and inlA were rooted using the three lineage III isolates in our data set as an outgroup. For some phylograms, the branch length of the outgroup was collapsed to best view the topology of the tree (collapsed branch length indicated by “//”). Maximum likelihood bootstrap support values (if >50) are shown as node labels. Genetic lineages assigned by EcoRI ribotyping are designated by different colors. Lineage I isolates (representing serotypes 1/2b [n = 32], 4b [n = 36], and 3b [n = 1]) are in red. Lineage II isolates (representing serotypes 1/2a [n = 43] and 1/2c [n = 4] as well one isolate that was untypeable [see supplemental Table 1]) are in green. Lineage III isolates (representing serotypes 4b [n = 1], 4a [n = 1] and one isolate that was untypeable [see supplemental Table 1]) are in blue. While lineage III isolates have previously been reported to predominantly represent serotypes 4a and 4c, recent data indicate that some lineage III isolates may also be serotype 4b (55). Large arrows indicate selected allelic types involved in recombination as identified by Sawyer's test (short purple and longer orange arrows indicate specific isolates and groups of isolates, respectively, involved in recombination); for inlA, allelic types involved in recombination were not identified due to the large number of recombination events in this gene.

Similar articles

Cited by

References

    1. Anisimova, M., R. Nielsen, and Z. Yang. 2003. Effect of recombination on the accuracy of the likelihood method for detecting positive selection at amino acid sites. Genetics 164:1229-1236. - PMC - PubMed
    1. Bart, A., C. Barnabe, M. Achtman, J. Dankert, A. van der Ende, and M. Tibayrenc. 2001. The population structure of Neisseria meningitidis serogroup A fits the predictions for clonality. Infect. Gen. Evol. 1:117-122. - PubMed
    1. Bromham, L., and D. Penny. 2003. The modern molecular clock. Nat. Rev. Genet. 3:216-224. - PubMed
    1. Cai, S., D. Y. Kabuki, A. Y. Kuaye, T. G. Cargioli, M. S. Chung, R. Nielsen, and M. Wiedmann. 2002. Rational design of DNA sequence-based strategies for subtyping Listeria monocytogenes. J. Clin. Microbiol. 40:3319-3325. - PMC - PubMed
    1. Czajka, J., N. Bsat, M. Piani, W. Russ, K. Sultana, M. Wiedmann, R. Whitaker, and C. A. Batt. 1993. Differentiation of Listeria monocytogenes and Listeria innocua by 16S rRNA genes and intraspecies discrimination of Listeria monocytogenes strains by random amplified polymorphic DNA polymorphisms. Appl. Environ. Microbiol. 59:304-308. - PMC - PubMed

Publication types

Substances

LinkOut - more resources