. 2005 Aug;187(16):5723-31.
doi: 10.1128/JB.187.16.5723-5731.2005.

The Escherichia coli CpxA-CpxR envelope stress response system regulates expression of the porins ompF and ompC

Affiliations

The Escherichia coli CpxA-CpxR envelope stress response system regulates expression of the porins ompF and ompC

Eric Batchelor et al. J Bacteriol. 2005 Aug.

Abstract

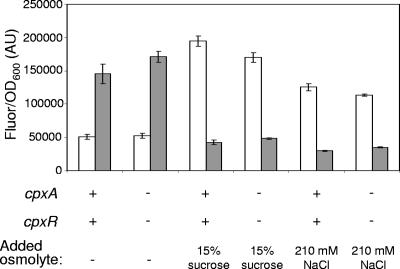
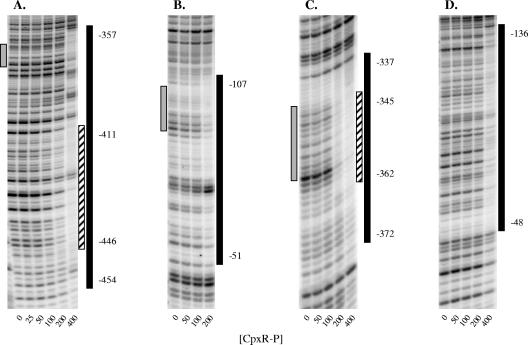
We performed transposon mutagenesis of a two-color fluorescent reporter strain to identify new regulators of the porin genes ompF and ompC in Escherichia coli. Screening of colonies by fluorescence microscopy revealed numerous mutants that exhibited interesting patterns of porin expression. One mutant harbored an insertion in the gene encoding the histidine kinase CpxA, the sensor for a two-component signaling system that responds to envelope stress. The cpxA mutant exhibited increased transcription of ompC and a very strong decrease in transcription of ompF under conditions in which acetyl phosphate levels were high. Subsequent genetic analysis revealed that this phenotype is dependent on phosphorylation of the response regulator CpxR and that activation of CpxA in wild-type cells results in similar regulation of porin expression. Using DNase I footprinting, we demonstrated that CpxR binds upstream of both the ompF and ompC promoters. It thus appears that two distinct two-component systems, CpxA-CpxR and EnvZ-OmpR, converge at the porin promoters. Within the context of envelope stress, outer membrane beta-barrel proteins have generally been associated with the sigma E pathway. However, at least for the classical porins OmpF and OmpC, our results show that the Cpx envelope stress response system plays a role in regulating their expression.


Figures

FIG. 1.
FIG. 1.
Ring fluorescence phenotype of colonies growing on medium A agar: YFP and CFP fluorescence images of a colony of MDG147 grown on medium A agar for 30 h. Images were obtained with a 250-ms YFP exposure and a 25-ms CFP exposure. The ratio of the two images was computed as described in the supplemental material. Images of colonies of mutants can also be found in the supplemental material.
FIG. 2.
FIG. 2.
Deletion of cpxA results in activation of ompC and repression of ompF in the MG1655 (a) and MC4100 (b) strain backgrounds. Porin expression was measured as CFP fluorescence (corresponding to ompC) (open bars) and YFP fluorescence (corresponding to ompF) (gray bars) in arbitrary units (AU), normalized by OD600, for strains grown in glucose minimal medium to the mid-log phase (see Materials and Methods). (a) Strains MDG147 (wild type), EPB54-012 (cpxA::kan), EPB62 (cpxR::spc, polar on cpxA), EPB28 [Δ(ackA-pta)::cat], and EPB81 [cpxA::kan Δ(ackA-pta)::cat]. (b) Strains MDG131 (wild type), EPB55-012 (cpxA::kan), EPB80 (cpxR::spc, polar on cpxA), EPB10 [Δ(ackA-pta)::cat], and EPB83 [cpxA::kan Δ(ackA-pta)::cat]. The bars indicate the means of at least three independent experiments, and the error bars indicate the standard deviations.
FIG. 3.
FIG. 3.
Elimination of the site of phosphorylation on CpxR eliminates the dependence of porin expression on CpxA. The strains used were MDG147 (wild type), EPB54-012 (cpxA::kan), EPB128 (cpxRD51A), and EPB218 (cpxRD51A cpxA::cat). Porin expression was measured as CFP fluorescence (corresponding to ompC) (open bars) and YFP fluorescence (corresponding to ompF) (gray bars) in arbitrary units (AU), normalized by OD600, for strains grown in glucose minimal medium to the mid-log phase (see Materials and Methods). The bars indicate the means of at least three independent experiments, and the error bars indicate the standard deviations.
FIG. 4.
FIG. 4.
Overexpression of NlpE, which activates the Cpx system, decreases ompF expression and increases ompC expression. The strains used were MDG147/pBR322, MDG147/pLD404, EPB62/pBR322, and EPB62/pLD404. Plasmid pLD404 was used to overexpress NlpE from a constitutive promoter, and pBR322 was used as a control. Porin expression was measured as CFP fluorescence (corresponding to ompC) (open bars) and YFP fluorescence (corresponding to ompF) (gray bars) in arbitrary units (AU), normalized by OD600. Strains were grown in glucose minimal medium with 50 μg/ml ampicillin to the mid-log phase (see Materials and Methods). The bars indicate the means of at least three independent experiments, and the error bars indicate the standard deviations.
FIG. 5.
FIG. 5.
CpxA* strain exhibits altered porin expression. The strains used were MDG147/pTrc99a (wild type), EPB54-012/pTrc99a (cpxA), EPB62/pTrc99a (cpxR cpxA), EPB54-012/pAS09b (cpxA*), and EPB62/pAS09b (cpxR cpxA*). Plasmid pAS09b was used to express CpxA*, and plasmid pTrc99a was used as a control. Porin expression was measured as CFP fluorescence (corresponding to ompC) (open bars) and YFP fluorescence (corresponding to ompF) (gray bars) in arbitrary units (AU), normalized by OD600. Strains were grown in glycerol minimal medium with 50 μg/ml ampicillin to the mid-log phase (see Materials and Methods). The bars indicate the means of at least three independent experiments, and the error bars indicate the standard deviations.
FIG. 6.
FIG. 6.
Porin protein levels are altered by Cpx activation. (a) SDS-PAGE analysis of cell envelopes of wild-type (MDG147), cpxA (EPB54-012), and cpxR cpxA (EPB62) cells grown in glucose minimal medium. (b) Quantification of protein levels. The open bars indicate the OmpC concentration, and the gray bars indicate the OmpF concentration, measured in arbitrary units (AU). The OmpF levels of EPB54-012 were below the level of detection of the assay (indicated by an asterisk). The bars indicate the means from three independent gels, and the error bars indicate the standard deviations. The gel contained 6 M urea and was stained with Coomassie blue.
FIG. 7.
FIG. 7.
Repression of OmpF by the Cpx system is independent of MicF: SDS-PAGE analysis of cell envelopes of EPB84 [Δ(micF-ompC)] and EPB89 [Δ(micF-ompC) cpxA::kan]. The gel contained 6 M urea and was stained with Coomassie blue.
FIG. 8.
FIG. 8.
CpxR represses ompF in an EnvZ strain. EPB91 (envZ) and EPB97 (envZ cpxA) were grown in glucose minimal medium to the mid-log phase. The expression of ompF was measured as YFP fluorescence normalized by OD600. The bars indicate the means of at least three independent experiments, and the error bars indicate the standard deviations.
FIG. 9.
FIG. 9.
Porin osmoregulation in cpxRA+ and cpxRA strains. The strains used were MDG147 (wild type) and EPB62 (cpxR::spc). Porin expression was measured as CFP fluorescence (corresponding to ompC) (open bars) and YFP fluorescence (corresponding to ompF) (gray bars) in arbitrary units (AU), normalized by OD600. Strains were grown in glucose minimal medium or glucose minimal medium supplemented with 15% sucrose or 210 mM NaCl to the mid-log phase (see Materials and Methods).
FIG. 10.
FIG. 10.
DNase I footprinting of CpxR-P at ompF and ompC. CpxR-P protects two distinct regions upstream of ompF (A and B) and of ompC (C and D). The concentration of CpxR-P (in nM) used in each lane is indicated at the bottom. The coordinates indicate positions relative to the ompF or ompC transcription start sites. Predicted CpxR binding sites (15) are indicated on the left by gray bars. Regions of protection are indicated by black bars and regions of higher affinity are indicated by striped bars on the right.
FIG. 11.
FIG. 11.
Summary of the results of DNase I footprinting of CpxR-P at ompF (a) and ompC (b). Regions of protection are indicated by black bars, and regions of higher affinity are indicated by striped bars. OmpR binding sites C1, C2, and C3 at ompC and F1, F2, F3, and F4 at ompF are also indicated. The numbers indicate the positions relative to the ompC and ompF transcription start sites.

References

    1. Ades, S. E. 2004. Control of the alternative sigma factor sigmaE in Escherichia coli. Curr. Opin. Microbiol. 7:157-162. - PubMed
    1. Alba, B. M., and C. A. Gross. 2004. Regulation of the Escherichia coli sigma-dependent envelope stress response. Mol. Microbiol. 52:613-619. - PubMed
    1. Amann, E., B. Ochs, and K. J. Abel. 1988. Tightly regulated tac promoter vectors useful for the expression of unfused and fused proteins in Escherichia coli. Gene 69:301-315. - PubMed
    1. Batchelor, E., and M. Goulian. 2003. Robustness and the cycle of phosphorylation and dephosphorylation in a two-component regulatory system. Proc. Natl. Acad. Sci. USA 100:691-696. - PMC - PubMed
    1. Batchelor, E., T. J. Silhavy, and M. Goulian. 2004. Continuous control in bacterial regulatory circuits. J. Bacteriol. 186:7618-7625. - PMC - PubMed

Publication types

MeSH terms

LinkOut - more resources