. 2005 Aug 3:5:26.
doi: 10.1186/1475-2867-5-26.

Rapid in vivo Taxotere quantitative chemosensitivity response by 4.23 Tesla sodium MRI and histo-immunostaining features in N-Methyl-N-Nitrosourea induced breast tumors in rats

Affiliations

Rapid in vivo Taxotere quantitative chemosensitivity response by 4.23 Tesla sodium MRI and histo-immunostaining features in N-Methyl-N-Nitrosourea induced breast tumors in rats

Rakesh Sharma et al. Cancer Cell Int. .

Abstract

Background: Sodium weighted images can indicate sodium signal intensities from different features in the tumor before and 24 hours following administration of Taxotere.

Aim: To evaluate the association of in vivo intracellular sodium magnetic resonance image intensities with immuno-biomarkers and histopathological features to monitor the early tumor response to Taxotere chemotherapy in Methyl-Nitroso-Urea induced rat xenograft breast tumors.

Methods and materials: Methyl-Nitroso-Urea (MNU) induced rat xenograft breast tumors were imaged for sodium MRI and compared with tumor histology, immunostaining after 24 hours chemotherapy.

Results: Sodium MRI signal intensities represented sodium concentrations. Excised tumor histological sections showed different in vitro histological end points i.e. single strand DNA content of cell nuclei during cell cycle (G1/S-G2/M), distinct S or M histograms (Feulgen labeling to nuclear DNA content by CAS 200), mitotic figures and apoptosis at different locations of breast tumors. Necrosis and cystic fluid appeared gray on intracellular (IC) sodium images while apoptosis rich regions appeared brighter on IC sodium images. After 24 hours Taxotere-treated tumors showed lower 'IC/EC ratio' of viable cells (65-76%) with higher mitotic index; apoptotic tumor cells at high risk due to cytotoxicity (>70% with high apoptotic index); reduced proliferation index (270 vs 120 per high power field) associated with enhanced IC sodium in vivo MR image intensities and decreased tumor size (3%; p < 0.001; n = 16) than that of pre-treated tumors. IC-Na MR signal intensities possibly indicated Taxotere chemosensitivity response in vivo associated with apoptosis and different pre-malignant features within 24 hours of exposure of cancer cells to anti-neoplastic Taxotere drug.

Conclusion: Sodium MRI imaging may be used as in vivo rapid drug monitoring method to evaluate Taxotere chemosensitivity response associated with neoplasia, apoptosis and tumor histology features.


Figures

Figure 1
Figure 1
The figure shows a spin echo pulse sequence with single quantum mode (A on left) and inversion recovery pulse sequence (B on right) using two inversion pulses for sodium imaging. The exponential return of the Mz after inversion is shown in graph in the center in relation to the RF pulses. The FID signal, produced by the 90° pulse after TE, has initial amplitude related to the value of Mz at the end of interval TI1 and TI2 due to applied selective π pulse. The insert highlights the unique optimum TI value in distinguishing tumor density associated with IC sodium in tumor.
Figure 2
Figure 2
Different 6 concentrations of Na (mM) and their SQ MRI signal intensities are shown in images (left panel) with their relationship as histogram bars and graph (right panels) between sodium concentrations of NaCl solutions and SQ MRI intensities. In second row at bottom, different sodium concentrations and their visibility is shown on left. Histogram bars and graph shows IR sodium MRI signal intensities with different sodium concentrations in 4% agarose.
Figure 3
Figure 3
(Top row) The phantom consists of two tubes, one is 1 M NaCl in solution and the other is 1 M NaCl in 4% agarose (Panel A). They simulate extracellular and intracellular sodium, respectively without use of inversion recovery pulse. It can be seen that an inversion time of TI = 20 ms completely suppressed intracellular sodium (Panel B) and TI = 30 ms completely suppressed the extracellular sodium signal from the tube containing NaCl in solution (Panel C). At TI = 40 ms partial suppression of extracellular sodium is highlighted (Panel D). (Middle row) Two 1 M NaCl phantom image intensities (with 4% agarose, open circles; and, without 4% agarose, closed circle) were plotted during single quantum acquisition and for 9 different inversion recovery times (TI) showed two distinct null points shown at right.
Figure 4
Figure 4
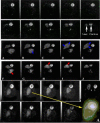
Taxotere chemosensitivity effect is compared on SQ images of pre- and post Taxotere treatment (first vs second rows on top). Panel on second row on rightmost image, represents the tumor SQ image (left arrow) and phantom (right arrow). Third and fourth rows represent the panels showing contrast (arrows) on contiguous intracellular sodium MRI images as "IR" images of pre- and post Taxotere treatment respectively by inversion recovery method. Panels in fifth and sixth rows represent the intracellular sodium signal intensity increases (arrows) in some areas representing active proliferation or resting viable cells. Loss of signal in late apoptosis rich regions and increased tumor areas can be seen as hypointense areas (panels in fifth row vs sixth row for pre- and post-injection of taxotere). An enlarged "IR" image (panel in sixth row) of tumor (on rightmost insert A) after segmentation image processing is shown with different bright, gray and darker pixel signal intensities.
Figure 5
Figure 5
The figure shows the stereotactic co-registration method of IR sodium tumor image, its counterpart histology and DNA ploidy map at different x- and y- co-ordinate locations shown as 1–5 and a-g for different areas. Notice the matched tumor delineated areas on three digitized images and corresponding features shown with arrows for high % apoptosis (A), high % EC volume (B), cyst (C), % viable cells and proliferation (D), % necrosis (E) in high power fields. The tumor IR sodium MR image appears hypointense for cyst and high EC regions and hyperintense for active proliferation while isointense for necrosis. On right panel, sodium signal intensities are shown for 100 mM SQ sodium phantom and 10 mM IR sodium phantom along with relative MRI signal intensities in the different tumor regions.
Figure 6
Figure 6
The sham control, pre-treatment and Taxotere post-treated animals (top panels on left) show tumors as SQ sodium (A) and IR sodium (B) images at 0 hr pre-Taxotere and 24 hours post-Taxotere treatment (panels A and B on second row). On third row on left, control tumor histology shows normal vesicles. Pre- and post treated excised tumor histology by trichrome staining is shown with delineated area. On fourth row on left, the excised tumor histology features in high power fields are shown with arrows (active viable cells (a), proliferation (b), necrosis (c), apoptosis (d), mitosis (e), fibrous cyst (f), and infiltrating ductile carcinonoma (g) in different x- and y- coordinate locations after coregistration with IR sodium images. On right, panels on top show a IR sodium MR image before (C) and after non-parametric segmentation by Optimas 6.5 to highlight the different signal intensities that appeared hyperintense, isointense, and gray-green colored on segmented image and histology features showed them as apoptosis (A), necrosis (B) and neoplasia (C). On right, second row shows corresponding S DNA histograms of neoplasia features by CAS 200 (panels on top), apoptosis staining (panel with green stain). On right, third row shows a post-Taxotere treated tumor histology by pentachrome stain to highlight mitotic figures (M) with active PMN cells (P) and high EC volume (EC) and corresponding digitized map of DNA cycle, with neoplasia shown as arrow.
Figure 7
Figure 7
The figure represents a comparison of different tumor pre-malignant and malignant features in coregistered sodium IR images (panels in first row with phantom P) and their counterpart histology in low power (second row). Notice the heterogeneous regions of tumor and corresponding distinct histopathology. At some selected locations, relative IR sodium MR signal intensities* (A.U.) with reference to sodium phantom P (50 A.U. in top panels) are shown as numbers and histograms (see Figure 8) as distinct values for different tumor stages with different tumor features by NIH Image J 1.63. Panels (1–22) show high power optical microscopy (images 1–8) in control 0 hour (on left) and post-Taxotere 24 hours treated tumors (images 9–22 on right) with distinct features shown by arrows.
Figure 8
Figure 8
The sodium IR MRI signal intensities and calculated IR sodium concentrations are shown as histograms for pre-malignant tumor features shown in Figure 7. In left panel A, different intracellular sodium MRI signal intensities and concentrations indicated for [intraductal proliferation 11.5(2); ductal hyperplacia 8.8 (3); apoptosis with intraductal carcinoma 12.4* (6,13) and active proliferation 6.2* (2); ductal carcinoma 14.2* (17); cribriform ductal carcinoma 12.8* (7); ductal comedo carcinoma 12.2* (4)]; Malignant features [papillary carcinoma 13.5* (9,11); invasive cribriform carcinoma 12.8* (18); invasive comedo carcinoma 13.5* (22); tubular carcinoma 13.8*; adenoma 12.5* (2,8)]. Tumor different histology features under high power fields are shown in brackets correspond with histology regions in Figure 7. The panel B, in center represents the match of IC sodium concentrations with IC sodium MRI signal intensities. In different tumor regions, IC sodium MRI concentrations were calculated relative to the phantom MRI signal intensities shown as linear curve in Figure 2. In the right panel C, IC sodium concentrations and MRI signal intensities at different tumor premalignant or malignant locations represent the possibility of quick assessment of tumor characterization with possible staging.
Figure 9
Figure 9
Comparison of delineated feature areas on intracellular sodium [Na]i images and histology digital images is shown at different levels for contiguous IR sodium MR slices (top row) and corresponding histology digital maps next to phantom (P). At bottom, each left bar represents histological area and each right bar represents delineated tumor area on both [Na]i image and histology digital images at different slice levels as shown in Table 5. Quantification of tumor area was done by Optimas 6.5 using sodium MRI and histology digital images. The tumor area was measured in mm2 in one representative tumor shown in Figure 8. Tumor area was measured and correlated in contiguous 6 histology sections with matched IR images (r2 = 0.3487) and scanned ss-DNA mAb digital images in mm2 (r2 = 0.3987). ss-DNA densities in arbitrary units were measured at different locations of the tumor digital images as shown in Figure 5.

Similar articles

Cited by

References

    1. Boada FE, Shen GX, Chang SY, Thulborn KR. Spectrally weighted twisted projection imaging: reducing T2 signal attenuation effects in fast three-dimensional sodium imaging. Magn Reson Med. 1997;38:1022–1028. - PubMed
    1. Ouwerkerk R, Bleich KB, Gillen JS, Pomper MG, Bottomley PA. Tissue sodium concentration in human brain tumors as measured with 23Na MR imaging. Radiology. 2003;227:529–537. - PubMed
    1. Clayton DB, Lenkinski RE. MR imaging of sodium in the human brain with a fast three-dimensional gradient-recalled-echo sequence at 4 T. Acad Radiol. 2003;10:358–365. doi: 10.1016/S1076-6332(03)80023-5. - DOI - PubMed
    1. Thompson HJ, Singh M, McGinley J. Classification of Premalignant and malignant lesions developing in the rat mammary gland after injection of sexually immature rats with 1-Methyl 1 Nitrosourea. J Mammary Gland Biology and Neoplasia. 2000;5:201–210. doi: 10.1023/A:1026495322596. - DOI - PubMed
    1. Kline R, Wu EX, Petrylak DP, Szabolcs M, Alderson PO, Weisfeldt ML, Cannon PJ, Katz J. Rapid in vivo monitoring of chemotherapeutic response using weighted sodium magnetic resonance imaging. Clin Cancer Res. 2000;6:2146–2156. - PubMed

LinkOut - more resources