Comparative Study
. 2005 Aug;113(8):969-77.
doi: 10.1289/ehp.8002.

Low doses of bisphenol A and diethylstilbestrol impair Ca2+ signals in pancreatic alpha-cells through a nonclassical membrane estrogen receptor within intact islets of Langerhans

Affiliations
Comparative Study

Low doses of bisphenol A and diethylstilbestrol impair Ca2+ signals in pancreatic alpha-cells through a nonclassical membrane estrogen receptor within intact islets of Langerhans

Paloma Alonso-Magdalena et al. Environ Health Perspect. 2005 Aug.

Abstract

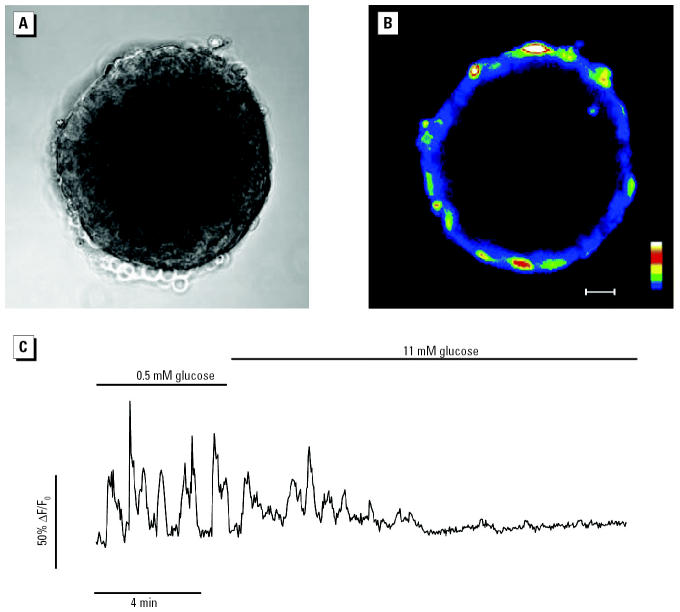
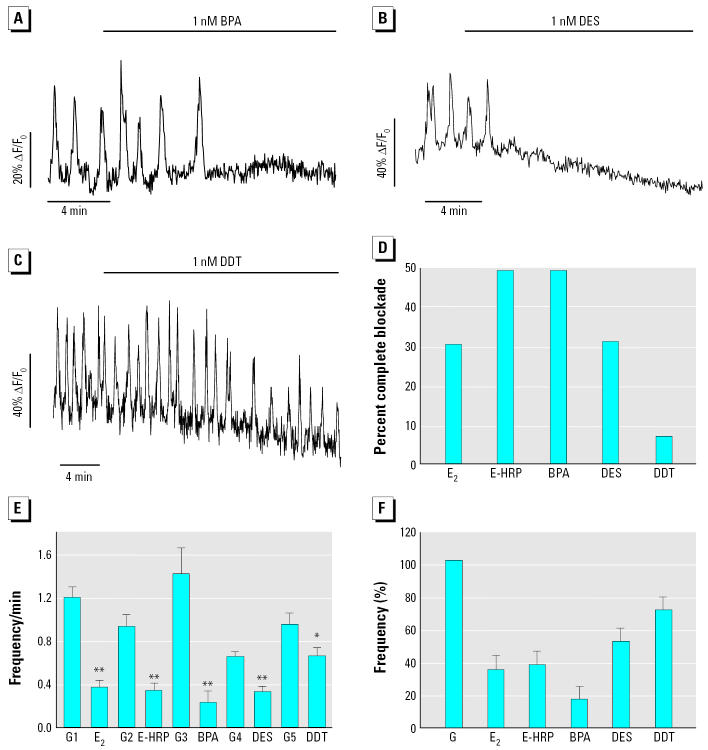
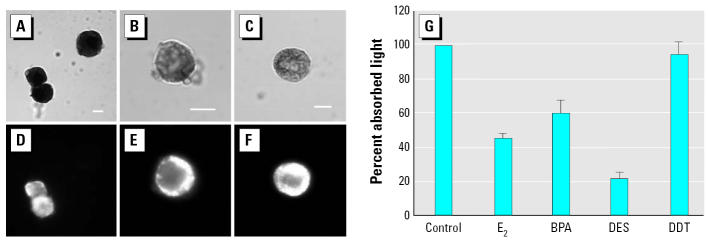
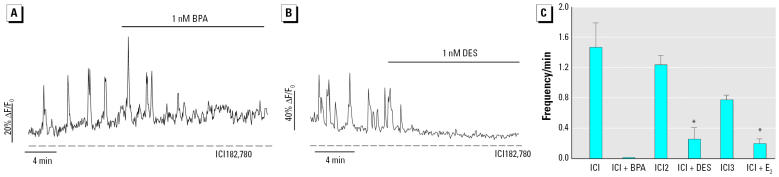
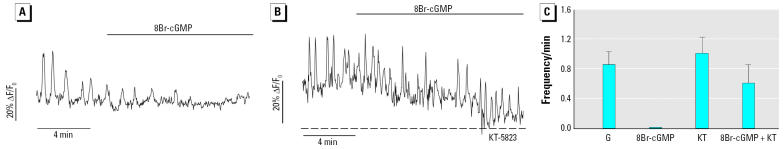
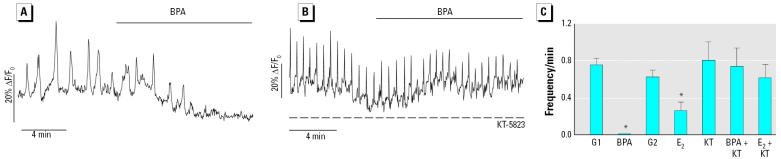
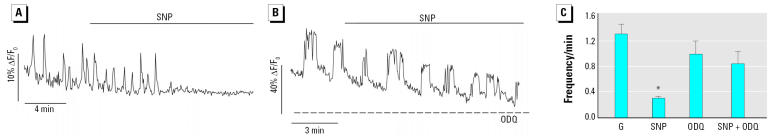
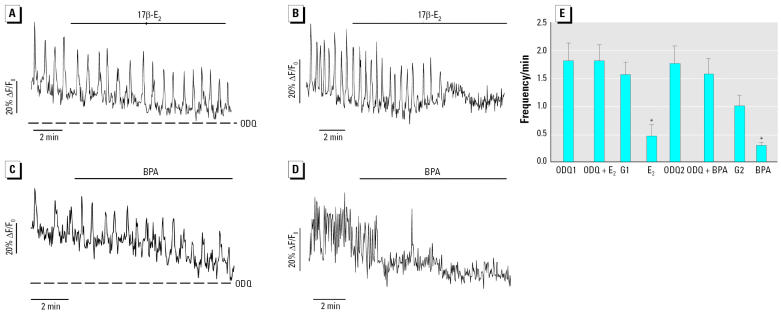
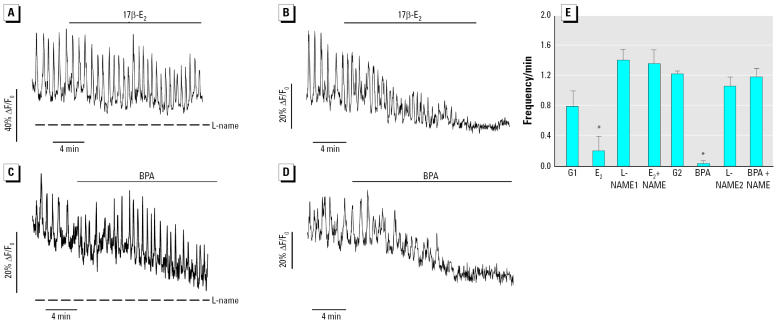
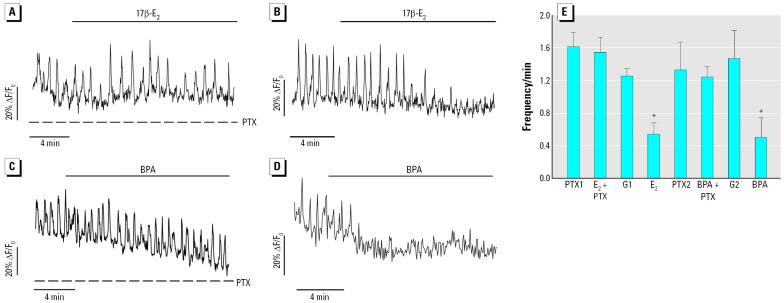
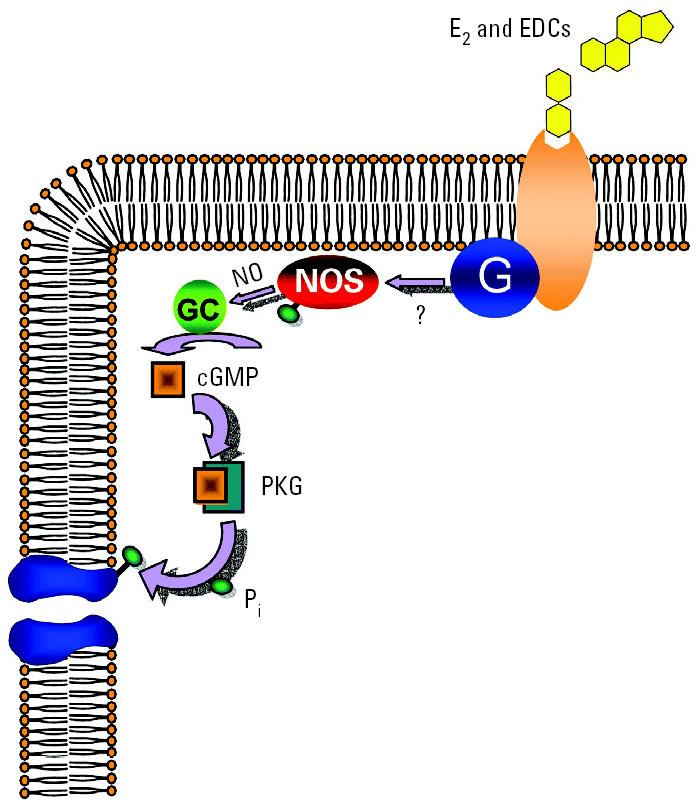
Glucagon, secreted from pancreatic alpha-cells integrated within the islets of Langerhans, is involved in the regulation of glucose metabolism by enhancing the synthesis and mobilization of glucose in the liver. In addition, it has other extrahepatic effects ranging from lipolysis in adipose tissue to the control of satiety in the central nervous system. In this article, we show that the endocrine disruptors bisphenol A (BPA) and diethylstilbestrol (DES), at a concentration of 10(-9) M, suppressed low-glucose-induced intracellular calcium ion ([Ca2+]i) oscillations in alpha-cells, the signal that triggers glucagon secretion. This action has a rapid onset, and it is reproduced by the impermeable molecule estradiol (E2) conjugated to horseradish peroxidase (E-HRP). Competition studies using E-HRP binding in immunocytochemically identified alpha-cells indicate that 17beta-E2, BPA, and DES share a common membrane-binding site whose pharmacologic profile differs from the classical ER. The effects triggered by BPA, DES, and E2 are blocked by the G alpha i- and G alpha o-protein inhibitor pertussis toxin, by the guanylate cyclase-specific inhibitor 1H-[1,2,4]oxadiazolo[4,3-a]quinoxalin-1-one, and by the nitric oxide synthase inhibitor N-nitro-L-arginine methyl ester. The effects are reproduced by 8-bromo-guanosine 3',5'-cyclic monophosphate and suppressed in the presence of the cGMP-dependent protein kinase inhibitor KT-5823. The action of E2, BPA, and DES in pancreatic alpha-cells may explain some of the effects elicited by endocrine disruptors in the metabolism of glucose and lipid.


Figures

Figure 1
Figure 1
Fluorescence changes monitored from individual cells within intact islets of Langerhans. (A) Transmission image of an intact islet of Langerhans. (B) Color image of the same islet of Langerhans shown in A loaded with the calcium-sensitive dye Fluo-3 and exposed to 0.5 mM glucose; bar = 20 μm (color scale: blue, low calcium; red, high calcium). (C) Islets exposed to 0.5 mM glucose were switched to 11 mM glucose, as indicated by the bars above the trace. Note that the low-glucose oscillatory pattern is suppressed in the presence of a high glucose concentration (11 mM).
Figure 2
Figure 2
Effect of EDCs on [Ca2+]i in pancreatic α-cells within the islets of Langerhans in response to 1 nM BPA (A), 1 nM DES (B), and 1 nM o, p′-DDT (C), in the presence of 0.5 mM glucose. (D) Percentage of cells with a complete blockade of [Ca2+]i oscillations 5 min after application of stimuli. (E) Effect on the frequency of [Ca2+]i oscillations after the stimuli were applied for 5 min and calculated over a 5–10 min period. G1–G5 are the frequencies of [Ca2+]i in the presence of 0.5 mM glucose measured during a 2–4 min interval before stimuli application, and E2, HRP, BPA, EDS, and DDT represent the frequency values after 5 min application of the compound (see “Materials and Methods” for details). (F) Frequency (%) of [Ca2+]i after stimuli compared with control conditions. Note that the decrease in the frequency is 80% in the presence of 1 nM BPA. Error bars in E and F indicate SE. *p < 0.01, **p < 0.0001, Student t-test, comparing each stimulus with its own control.
Figure 3
Figure 3
Binding assays with E-HRP and HRP and competition with E2, BPA, DES, and DDT. (A–C) Transmission images of nonpermeabilized pancreatic cells with E-HRP or HRP developed using Co-DAB: (A) cells incubated with E-HRP as control, (B) competition of 30 μM DES for the binding site of E-HRP, and (C) background staining with 100 nM HRP. (D–F) Glucagon-secreting cells identified by immunocytochemistry: (D) identification of the α-cells present in (A), (E) the same α-cell as in (B), and (F) the same cell as in (C) stained with antiglucagon antibody. (G) Competition for E-HRP binding site at the plasma membrane by 30 μM E2, BPA, DES, and DDT. Background binding obtained with 100 nM HRP has been subtracted. Data are from three duplicate experiments, expressed as mean + SE. Bars = 5 μm.
Figure 4
Figure 4
Effects of the pure antiestrogen ICI182,780 (1 μM) on 1 nM BPA (A) and 1 nM DES (B) action on low-glucose–induced [Ca2+]i oscillations. ICI182,780 was perfused for at least 20 min before stimuli were added, and it was maintained during the whole period. (C) Mean frequencies in [Ca2+]i oscillations in the presence of ICI182,780 (ICI) for each experiment (ICI1–ICI3) and in the presence of each stimulus. Results are representative of at least eight cells from four different islets, expressed as mean ± SE. *p < 10−5, Student t-test comparing each stimulus with its own control.
Figure 5
Figure 5
Effects of 8Br-cGMP on EDCs and E2 via PKG. (A) Exposure to 10 μM 8Br-cGMP dramatically reduces the frequency of low-glucose–induced [Ca2+]i oscillations. (B) After incubation with the specific PKG inhibitor KT-5823 (1 μM), 8Br-cGMP fails to evoke the marked reduction in [Ca2+]i oscillations shown in (A). (C) Mean frequency values collected in the presence of 0.5 mM glucose (G), 8Br-cGMP plus 0.5 mM glucose (8Br-cGMP), KT-5823 (KT), and 8Br-cGMP plus KT-5823 (8Br-cGMP + KT). Results are representative of at least five cells in four different islets, expressed as mean ± SE.
Figure 6
Figure 6
Effects of BPA on [Ca2+]i oscillations through a PKG-mediated mechanism. (A) Low-glucose–induced [Ca2+]i oscillations blocked by 1 nM BPA. (B) Frequency of [Ca2+]i oscillations were not reduced by BPA in an islet from the same preparation and maintained in the same conditions but pretreated with and exposed to the PKG inhibitor KT-5823 (1 μM). (C) Mean frequency values of 0.5 mM glucose before application of either BPA (G1) or E2 (G2), in the presence of 1 nM BPA or 1 nM E2, as in (A), or in the presence of 1 μM KT-5823 plus 0.5 mM glucose (KT); KT plus 1 nM BPA (BPA + KT), and KT plus 1 nM 17β-E2 (E2 + KT) as in (B). Results are representative of at least 12 cells from nine different islets, expressed as mean ± SE. *p < 0.0001, Student t-test comparing E2 with glucose or BPA with glucose.
Figure 7
Figure 7
Effects of ODQ on SNP action. (A) SNP (100 μM) produces a rapid blockade of low-glucose–induced [Ca2+]i oscillations. (B) When SNP (100 μM) is applied in the presence of ODQ (10 μM), the frequency of [Ca2+]i oscillations does not vary compared with that observed in the presence of ODQ alone. (C) Mean frequency values of 0.5 mM glucose (G) and 100 μM SNP as in (A), and 0.5 mM glucose plus ODQ (ODQ), and ODQ plus SNP (SNP + ODQ) as in (B). Results are representative of at least four cells in four different islets, expressed as mean ± SE. *p < 10−5, Student t-test comparing E2 with G1 and BPA with G2.
Figure 8
Figure 8
Effect of E2 and BPA involving a GC. (A) When 1 nM 17β-E2 is applied in the presence of 10 μM ODQ, the [Ca2+]i oscillatory pattern is not modified. (B) Control experiment performed with an islet from the same preparation and maintained in the same conditions as in (A) but without ODQ. (C) Treatment with 10 μM ODQ prevents the effect of 1 nM BPA. (D) Control experiment performed with an islet from the same preparation and maintained in the same conditions as in (C) but without ODQ. (E) Mean frequency values for experiments as in (A): 0.5 mM glucose and 10 μM ODQ (ODQ1), 1 nM 17β-E2 in the presence of 10 μM ODQ (ODQ + E2); experiments as in (B): 0.5 mM glucose (G1), 1 nM 17β-E2; experiments as in (C): 0.5 mM glucose and 10 μM ODQ (ODQ2), 1 nM BPA in the presence of ODQ (ODQ + BPA); experiments as in (D): 0.5 mM glucose (G2), 1 nM BPA. Results are representative of at least six cells from five different islets, expressed as mean ± SE. *p < 10−5, Student t-test comparing E2 with G1 and BPA with G2.
Figure 9
Figure 9
The NOS blocker L-NAME inhibits E2 and BPA actions. (A) When 1 nM 17β-E2 is applied in the presence of 100 μM L-NAME, the [Ca2+]i oscillatory pattern is not modified. (B) Control experiment performed with an islet from the same preparation and maintained in the same conditions as in (A) but without L-NAME. (C) Treatment with 100 μM L-NAME prevents the effect of 1 nM BPA. (D) Control experiment performed with an islet from the same preparation and maintained in the same conditions as in (C) but without L-NAME. (E) Mean frequency values for experiments as in (A): 0.5 mM glucose and 100 μM L-NAME (L-NAME1), 1 nM 17β-E2 in the presence of 100 μM L-NAME (E2 + NAME); experiments as in (B): 0.5 mM glucose (G1), 1 nM 17β-E2; experiments as in (C): 0.5 mM glucose and 100 μM L-NAME (L-NAME2), 1 nM BPA in the presence of L-NAME (BPA + NAME); experiments as in (D): 0.5 mM glucose (G2), 1 nM BPA. Results are representative of at least 10 cells from eight different islets, expressed as mean ± SE. *p < 10−5, Student t-test comparing E2 with G1 and BPA with G2.
Figure 10
Figure 10
E2 and BPA action is PTX sensitive. (A) Treatment of cells with the G-protein inhibitor PTX (100 ng/mL) for 4 hr completely abolishes 1 nM 17β-E2 action on [Ca2+]i oscillations. (B) A control experiment performed with an islet from the same preparation and maintained in the same conditions as in (A) but without PTX. (C) Treatment with PTX prevents the effect of 1 nM BPA. (D) Control experiment performed with an islet from the same preparation and maintained in the same conditions as in (C) but without PTX. (E) Mean frequency values for experiments as in (A): 0.5 mM glucose and PTX (PTX1), 1 nM 17β-E2 in the presence of PTX (E2 + PTX); experiments as in (B): 0.5 mM glucose (G1), 1 nM 17β-E2; experiments as in (C): 0.5 mM glucose and PTX (PTX2), 1 nM BPA in the presence of PTX (BPA + PTX); experiments as in (D): 0.5 mM glucose (G2), 1 nM BPA, Results are representative of at least 10 cells from five different islets, expressed as mean ± SE. *p < 10−5, Student t-test comparing E2 with G1 and BPA with G2.
Figure 11
Figure 11
Hypothetical model of the molecular pathway involved in E2-induced [Ca2+]i regulation in α-cells. Abbreviations: G, G-protein; Pi, intra-cellular phosphate. 17β-E2 and EDCs activate a PTX-sensitive pathway, indicating either that a G-protein–coupled receptor (GPCR) is involved or that a receptor with a different structure from GPCRs is coupled to a classical GPCR that activates a G-protein. This receptor is coupled in a yet undetermined manner with NOS, which generates NO. This activates soluble GC, which increases cGMP levels, which activates PKG, regulating ion channels and producing the abolishment of low-glucose–induced [Ca2+]i.

References

    1. Akesson B, Henningsson R, Salehi A, Lundquist I. Islet constitutive nitric oxide synthase and glucose regulation of insulin release in mice. J Endocrinol. 1999;163:39–48. - PubMed
    1. Alexaki VI, Charalampopoulos I, Kampa M, Vassalou H, Theodoropoulos P, Stathopoulos EN, et al. Estrogen exerts neuroprotection effects via membrane estrogen receptors and rapid Akt/NOS activation. FASEB J. 2004;18:1594–1596. doi: 10.1096/fj.04-1495fje. - DOI - PubMed
    1. Berne RM, Levy MN. 1993. Physiology. St Louis:Mosby-Year Book, 867–871.
    1. Berts A, Ball A, Gylfe E, Hellman B. Suppression of Ca2+ oscillations in glucagon-producing alpha 2-cells by insulin/glucose and amino acids. Biochim Biophys Acta. 1996;1310:212–216. - PubMed
    1. Brotons JA, Olea-Serrano MF, Villalobos M, Pedraza V, Olea N. Xenoestrogens released from lacquer coatings in food cans. Environ Health Perspect. 1995;103:608–612. - PMC - PubMed

Publication types

MeSH terms

LinkOut - more resources