. 2005 Aug;113(8):1032-8.
doi: 10.1289/ehp.7996.

Seasonal variations in air pollution particle-induced inflammatory mediator release and oxidative stress

Affiliations

Seasonal variations in air pollution particle-induced inflammatory mediator release and oxidative stress

Susanne Becker et al. Environ Health Perspect. 2005 Aug.

Abstract

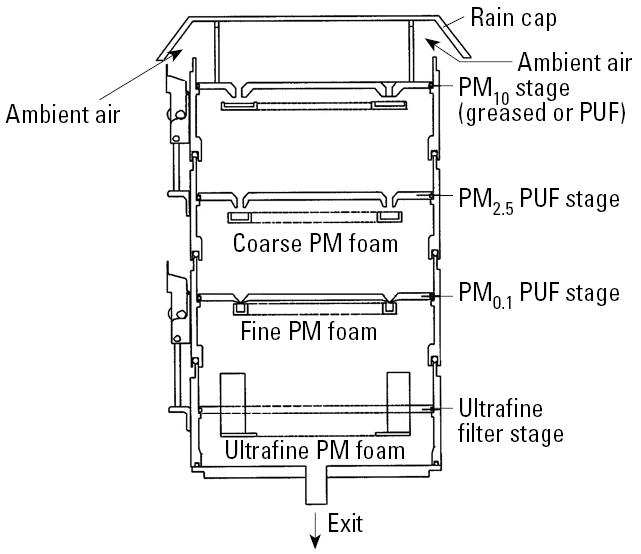
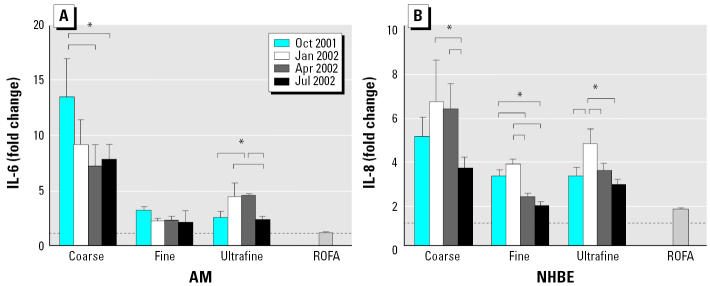
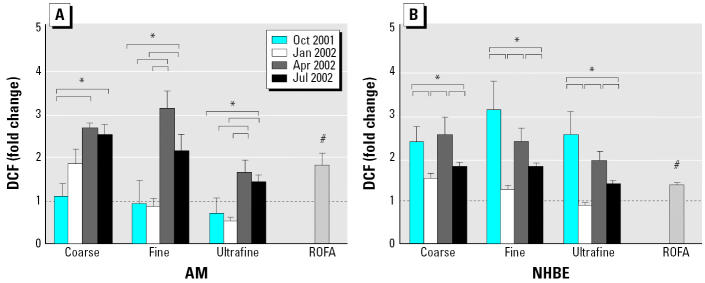
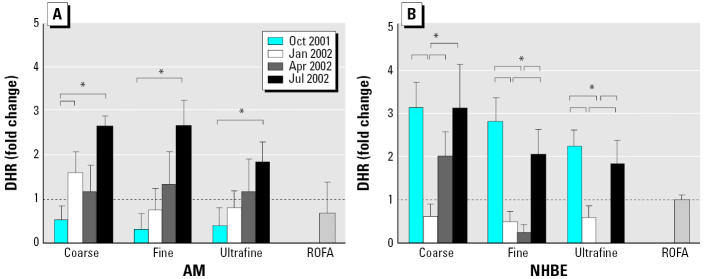
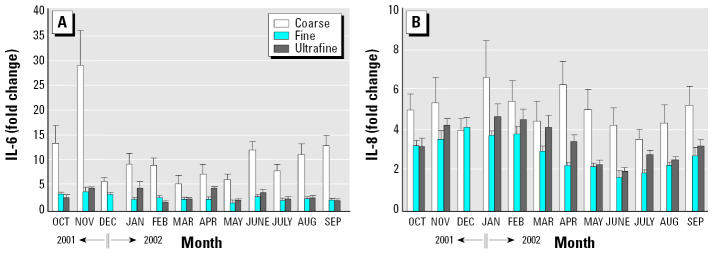
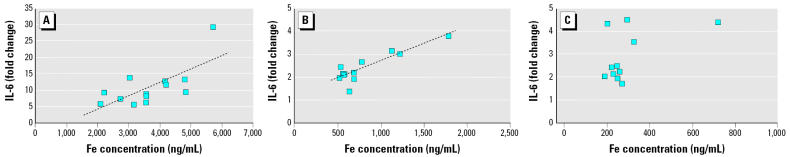
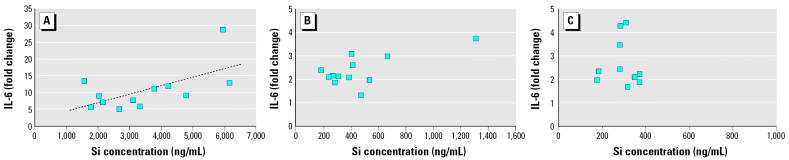
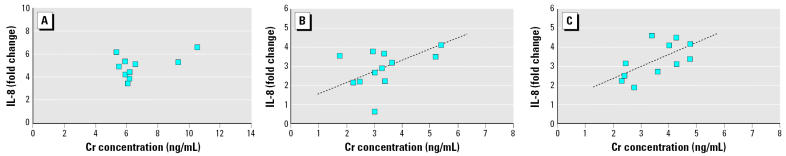
Health effects associated with particulate matter (PM) show seasonal variations. We hypothesized that these heterogeneous effects may be attributed partly to the differences in the elemental composition of PM. Normal human bronchial epithelial (NHBE) cells and alveolar macrophages (AMs) were exposed to equal mass of coarse [PM with aerodynamic diameter of 2.5-10 microm (PM(2.5-10)], fine (PM(2.5)), and ultrafine (PM(<0.1)) ambient PM from Chapel Hill, North Carolina, during October 2001 (fall) and January (winter), April (spring), and July (summer) 2002. Production of interleukin (IL)-8, IL-6, and reactive oxygen species (ROS) was measured. Coarse PM was more potent in inducing cytokines, but not ROSs, than was fine or ultrafine PM. In AMs, the October coarse PM was the most potent stimulator for IL-6 release, whereas the July PM consistently stimulated the highest ROS production measured by dichlorofluorescein acetate and dihydrorhodamine 123 (DHR). In NHBE cells, the January and the October PM were consistently the strongest stimulators for IL-8 and ROS, respectively. The July PM increased only ROS measured by DHR. PM had minimal effects on chemiluminescence. Principal-component analysis on elemental constituents of PM of all size fractions identified two factors, Cr/Al/Si/Ti/Fe/Cu and Zn/As/V/Ni/Pb/Se, with only the first factor correlating with IL-6/IL-8 release. Among the elements in the first factor, Fe and Si correlated with IL-6 release, whereas Cr correlated with IL-8 release. These positive correlations were confirmed in additional experiments with PM from all 12 months. These results indicate that elemental constituents of PM may in part account for the seasonal variations in PM-induced adverse health effects related to lung inflammation.


Figures

Figure 1
Figure 1
A schematic for the ChemVol model 2400 high-volume cascade impactor. The ambient air sample stream enters the sampler from the top between the rain cap and the PM10 stage and exits from the bottom. The cascade impactor contains a PM10 stage for collecting particles > 10 μm in diameter, a PM2.5 stage for collecting coarse PM (PM2.5–10), a PM0.1 stage for collecting fine PM (PM0.1–2.5), and an ultrafine filter for collecting ultrafine PM (PM< 0.1). The figure has been modified from the original schematic provided by Thermo Electron Corporation (R&P Products) with permission.
Figure 2
Figure 2
Production of (A) IL-6 by AM and (B) IL-8 by NHBE cells stimulated with coarse, fine, and ultrafine Chapel Hill pollution particles collected in four different months. The control IL-8 and IL-6 concentrations were 1.7 ± 0.2 ng/mL and 198 ± 5 pg/mL, respectively. Particles were added to NHBE cells at 11 μg/mL and to AMs at 50 μg/mL. *Tukey adjusted p-value < 0.05; n = 3–4 each. The dashed line denotes 1.0 (no change over control). The brackets indicate the groups that are significantly different by ANOVA and the Tukey subtest.
Figure 3
Figure 3
Production of ROSs measured by DCF in (A) AM and (B) NHBE cells stimulated with coarse, fine, and ultrafine Chapel Hill pollution particles collected in four different months. Particles were added to NHBE cells at 11 μg/mL and to AMs at 50 μg/mL. In general, NHBE cells appeared to be more responsive to PM than the AMs because increases in DCF signals were similar between the two cell types even though NHBE cells were exposed to lower doses of PM. *Tukey adjusted p-value < 0.05; #p < 0.05 versus control (ratio = 1.0) by the one-group Student t-test; n = 3–4 each. The dashed line denotes 1.0 (no change over control). The brackets indicate groups that are significantly different by the Tukey subtest.
Figure 4
Figure 4
Production of ROSs measured by DHR in (A) AM and (B) NHBE cells stimulated with coarse, fine, and ultrafine Chapel Hill pollution particles collected in four different months. Particles were added to NHBE cells at 11 μg/mL and to AMs at 50 μg/mL. In general, NHBE cells appeared more responsive to PM than were AMs because increases in DHR signals were similar between the two cell types even though NHBE cells were exposed to lower doses of PM. *Tukey adjusted p-value < 0.05; n = 3–4 each. The dashed line denotes 1.0 (no change over control). The brackets indicate groups that are significantly different by ANOVA and the Tukey subtest.
Figure 5
Figure 5
Effects of PM from 12 different months on the release of (A) IL-6 in AMs and (B) IL-8 in NHBE cells. Particles were added to AMs at 50 μg/mL and to NHBE cells at 11 μg/mL. The data for December ultrafine PM were not available and were omitted in the figure; n = 3–4 each.
Figure 6
Figure 6
Correlations between Fe and IL-6 release in AMs incubated with (A) coarse, (B) fine, and (C) ultrafine PM from 12 months. The dashed line represents the linear regression line. The overall model p-values for coarse, fine, and ultrafine PM were 0.012, 0.0002, and 0.103, respectively. R2 = 0.4862 and 0.7704 for coarse and fine particles, respectively.
Figure 7
Figure 7
Association between Si and IL-6 release in AMs incubated with (A) coarse, (B) fine, and (C) ultrafine PM from 12 months. The dashed line represents the linear regression line. The overall model p-values for coarse, fine, and ultrafine PM were 0.034, 0.016 (0.507 if the data with the largest Si concentration are excluded), and 0.182, respectively. R2 = 0.3747 for coarse PM.
Figure 8
Figure 8
Correlations between Cr and IL-8 release in NHBE cells incubated with (A) coarse, (B) fine, and (C) ultrafine PM from 12 months. The dashed line represents the linear regression line. The overall model p-values for coarse, fine, and ultrafine PM were 0.106, 0.003, and 0.036, respectively. R2 = 0.6082 and 0.401 for fine and ultrafine PM, respectively.

Similar articles

Cited by

References

    1. Alfaro-Moreno E, Martinez L, Garcia-Cuellar C, Bonner JC, Murray JC, Rosas I, et al. Biologic effects induced in vitro by PM10 from three different zones of Mexico City. Environ Health Perspect. 2002;110:715–720. - PMC - PubMed
    1. Anderson HR, Bremner SA, Atkinson RW, Harrison RM, Walters S. Particulate matter and daily mortality and hospital admissions in the west midlands conurbation of the United Kingdom: associations with fine and coarse particles, black smoke and sulphate. Occup Environ Med. 2001;58:504–510. - PMC - PubMed
    1. Artinano B, Salvador P, Alonso DG, Querol X, Alastuey A. Anthropogenic and natural influence on the PM(10) and PM(2.5) aerosol in Madrid (Spain). Analysis of high concentration episodes. Environ Pollut. 2003;125:453–465. - PubMed
    1. Becker S, Soukup JM, Gilmour MI, Devlin RB. Stimulation of human and rat alveolar macrophages by urban air particulates: effects on oxidant radical generation and cytokine production. Toxicol Appl Pharmacol. 1996;141:637–648. - PubMed
    1. Becker S, Soukup JM, Sioutas C, Cassee FR. Response of human alveolar macrophages to ultrafine, fine, and coarse urban air pollution particles. Exp Lung Res. 2003;29:29–44. - PubMed

MeSH terms