

doi: 10.1534/genetics.105.045930.
Epub 2005 Aug 3.
A statistical multiprobe model for analyzing cis and trans genes in genetical genomics experiments with short-oligonucleotide arrays
Affiliations
- PMID: 16079228
- PMCID: PMC1456841
- DOI: 10.1534/genetics.105.045930
Item in Clipboard
A statistical multiprobe model for analyzing cis and trans genes in genetical genomics experiments with short-oligonucleotide arrays
Genetics.
2005 Nov.
Abstract
Short-oligonucleotide arrays typically contain multiple probes per gene. In genetical genomics applications a statistical model for the individual probe signals can help in separating "true" differential mRNA expression from "ghost" effects caused by polymorphisms, misdesigned probes, and batch effects. It can also help in detecting alternative splicing, start, or termination.
Figures
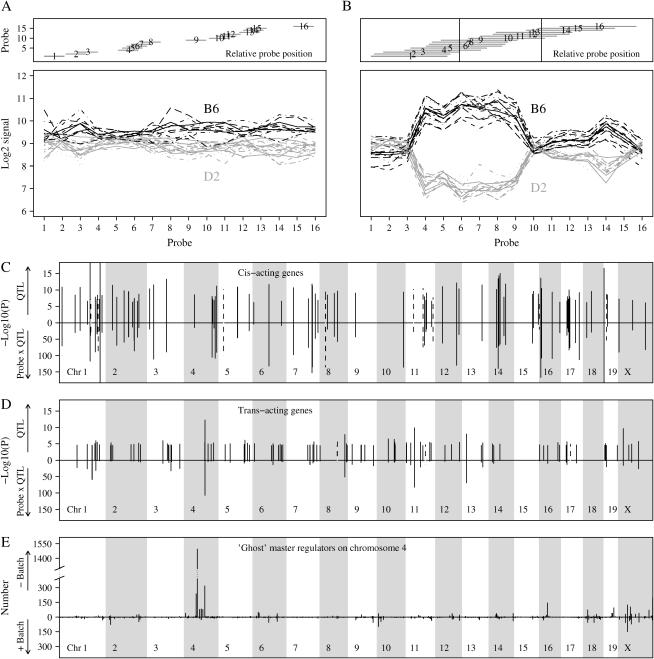
Model parameterization and fitting: two examples and whole-genome results. (A) Expression profiles of 30 mice, adjusted for the effects of probe, batch, and probe-specific batch effects, are shown for probe set 103036_at. The mice with solid (shaded) profile carry the B6 (D2) allele at marker D15Mit158. Expression difference is relatively constant across the 16 probes. (B) Similar plot for probe set 96243_f_at and marker D1Mit145. In this case the expression difference is highly variable between probes; i.e., there is probe-by-QTL interaction. We sequenced our D2 strain and found an influential polymorphism at relative base position 30 in probes 4–9 and a second polymorphism at position 57 in probes 11–15 (see vertical lines). The direction of the QTL effect is indeed such that the B6 allele has higher signal than the D2 allele. (C) Results of the QTL analyses on all probe sets. Significance of QTL (top) and of probe-by-QTL interaction (bottom) is shown for the 100 most significant cis-acting probe sets. The dotted lines indicate probe sets carrying a currently known SNP. (D) Similar plot for the 100 most significant trans-acting probe sets. (E) Results of the QTL analyses on all probe sets. At each genome position the number of probe sets is shown that significantly map to that position, on the basis of either a model ignoring possible batch effects (top) or a model including batch and probe-specific batch effects (bottom).
References
-
- Bolstad, B. M., R. A. Irizarry, M. Astrand and T. P. Speed, 2003. A comparison of normalization methods for high density oligonucleotide array data based on variance and bias. Bioinformatics 19: 185–193. - PubMed
-
- Bystrykh, L., E. Weersing, B. Dontje, S. Sutton, M. T. Pletcher et al., 2005. Uncovering regulatory pathways that affect hematopoietic stem cell function using ‘genetical genomics’. Nat. Genet. 37: 225–232. - PubMed
-
- Chesler, E. J., L. Lu, J. Wang, R. W. Williams and K. F. Manly, 2004. WebQTL: rapid exploratory analysis of gene expression and genetic networks for brain and behavior. Nat. Neurosci. 7: 485–486. - PubMed
-
- Gautier, L., L. Cope, B. M. Bolstad and R. A. Irizarry, 2004. affy—analysis of Affymetrix GeneChip data at the probe level. Bioinformatics 20: 307–315. - PubMed
Publication types
MeSH terms
Substances
LinkOut - more resources
Full Text Sources
