Comparative Study
. 2005 Dec;22(12):2386-94.
doi: 10.1093/molbev/msi229. Epub 2005 Aug 3.

Evolutionary change of the numbers of homeobox genes in bilateral animals

Affiliations
Comparative Study

Evolutionary change of the numbers of homeobox genes in bilateral animals

Jongmin Nam et al. Mol Biol Evol. 2005 Dec.

Abstract

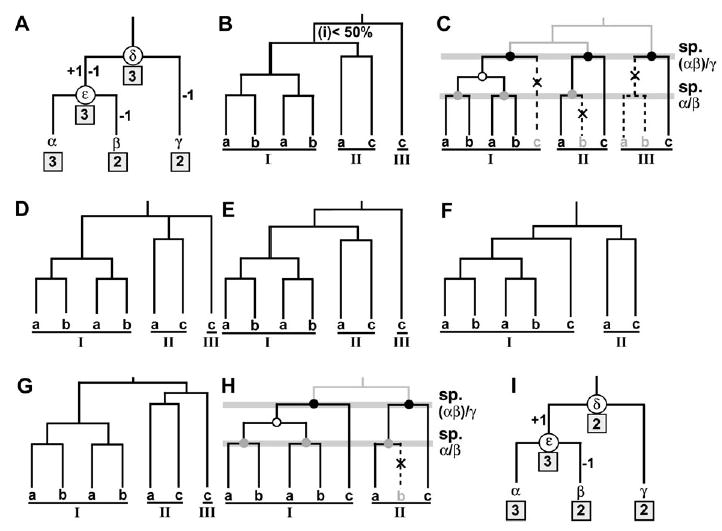
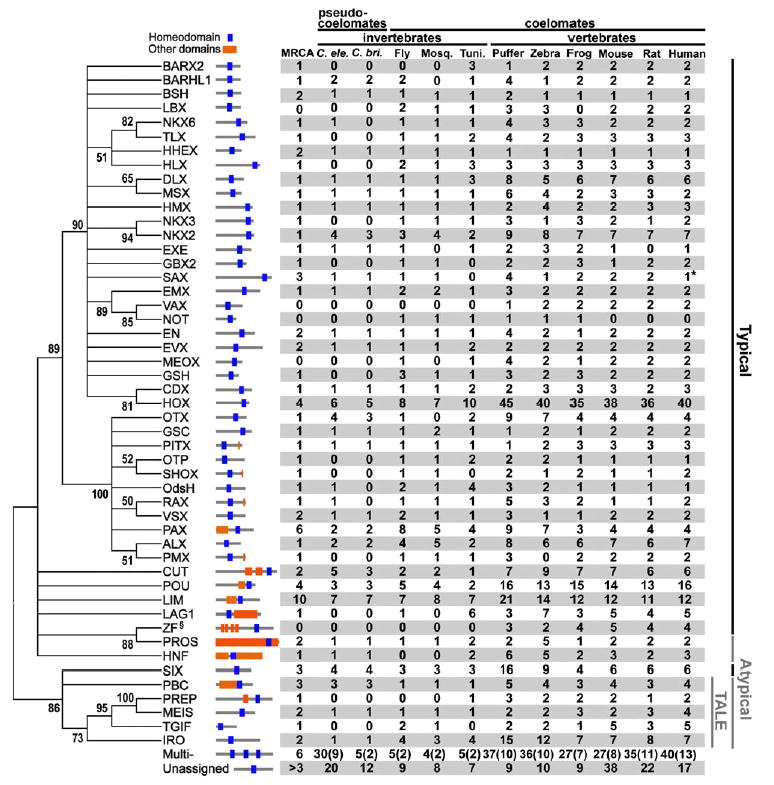
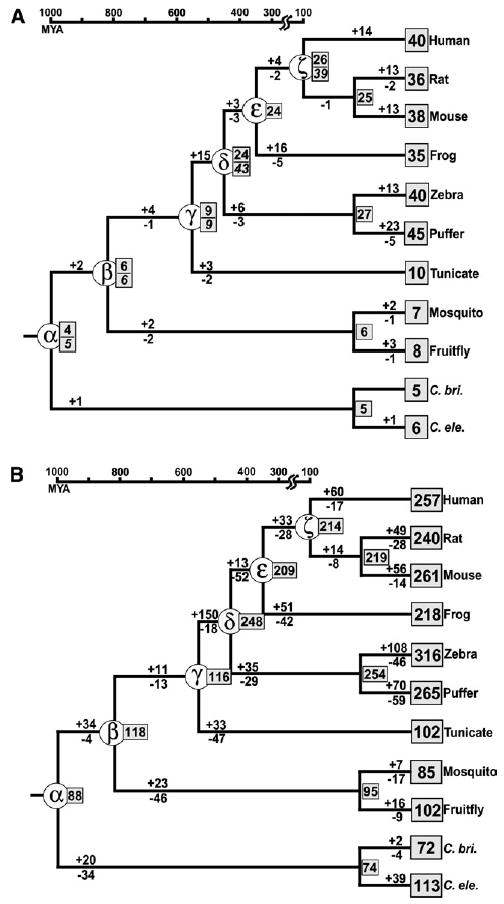
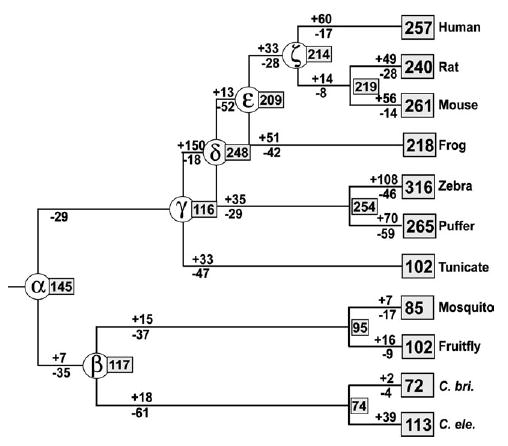
It has been known that the conservation or diversity of homeobox genes is responsible for the similarity and variability of some of the morphological or physiological characters among different organisms. To gain some insights into the evolutionary pattern of homeobox genes in bilateral animals, we studied the change of the numbers of these genes during the evolution of bilateral animals. We analyzed 2,031 homeodomain sequences compiled from 11 species of bilateral animals ranging from Caenorhabditis elegans to humans. Our phylogenetic analysis using a modified reconciled-tree method suggested that there were at least about 88 homeobox genes in the common ancestor of bilateral animals. About 50-60 genes of them have left at least one descendant gene in each of the 11 species studied, suggesting that about 30-40 genes were lost in a lineage-specific manner. Although similar numbers of ancestral genes have survived in each species, vertebrate lineages gained many more genes by duplication than invertebrate lineages, resulting in more than 200 homeobox genes in vertebrates and about 100 in invertebrates. After these gene duplications, a substantial number of old duplicate genes have also been lost in each lineage. Because many old duplicate genes were lost, it is likely that lost genes had already been differentiated from other groups of genes at the time of gene loss. We conclude that both gain and loss of homeobox genes were important for the evolutionary change of phenotypic characters in bilateral animals.


Figures

Fig. 1
Fig. 1
A simple example illustrating the method for estimating the numbers of ancestral, gained, and lost genes. We assume that there are three species (species α, β, and γ), and species α, β, and γ have three, two, and two genes, respectively. (A) The species tree and the numbers of ancestral, gained, and lost genes. The MRCA of species α, β, and γ and the MRCA of species α and β are labeled δ and ɛ, respectively. The numbers within square boxes are the numbers of genes in extant species (species α, β, and γ) or ancestral species (species δ and ɛ). The numbers of genes gained and lost in each ancestral branch are shown on the right and left sides of each branch, respectively. (B) The gene tree of the seven genes. (C) The reconciled tree of (A) and (B). Black and gray dots stand for speciation events (sp.), empty black circles for gene duplication events, and crosses for gene losses. (D) The condensed tree of (B). (E)–(G) Three possible gene trees that can be inferred from the condensed tree in (D). (H) The simplest reconciled tree of (D). (I) The species tree and the numbers of ancestral, gained, and lost genes counted from (H).
Fig. 2
Fig. 2
Evolutionary relationships of 49 different families of homeobox genes and their phylogenetic distribution in the 11 species of bilateral animals. The tree is constructed by the neighbor-joining method using average p-distances between 49 groups and is a 50% bootstrap consensus tree (100 bootstrap replications). Bootstrap values higher than 50% are shown. Representative domain organization is shown on the right-hand side of each family name. Black vertical lines indicate the typical homeobox gene family and gray vertical lines the atypical homeobox gene family. Each blue square indicates a homeodomain, and orange squares indicate the conserved family-specific domains. Gray horizontal lines indicate full-length proteins. Domains of E value < 0.01 in the HMM search are shown. The numbers of homeobox genes for each family in each species is also shown. Numbers in parentheses are the numbers of homeoboxes from multihomeobox genes. Numbers under ‘‘MRCA’’ are the estimated numbers of homeobox genes in the MRCA of the 11 species using species trees based on the Coelomata hypothesis. No SAX family gene was found in the annotated data set of human genes from the ENSEMBL. However, the annotation data set of human genes from the GenBank contains one copy of SAX group gene. We therefore included this gene in this tabulation (number with ‘‘*’’ mark). We did not show any ZF homeobox genes in invertebrates, though there are ZF homeobox genes in these animals. This is because the ZF homeobox genes (subfamily with ‘‘§’’ mark) in invertebrates are either ZF multihomeobox genes that have their own vertebrate multihomeobox orthologs or unclassified genes that appear to have been derived from multihomeobox genes (data not shown). Note that the SIX family genes are typical homeobox genes and that the gene numbers for the HOX gene family are slightly higher than those of the genes in the HOX cluster. This is because other closely related genes (e.g., IPF) were also included in this family. We used the same notations as Burglin’s (2005) to represent homeobox gene families.
Fig. 3
Fig. 3
Estimated numbers of ancestral, gained, and lost genes during the evolution of bilateral animals when the Coelomata tree is used. Species name is given on the right-hand side of each external node. Ancestral species of our interest are labeled by α to ζ. The number within a square box is the number of genes in each extant species or ancestral species. The numbers above and below each branch are the numbers of gained and lost genes, respectively. The divergence times for ancestral nodes α, β, δ, ɛ, and ζ are based on the molecular clock (Kumar and Hedges 1998; Nei, Xu, and Glazko 2001) and that for node γ is based on the fossil record (Shu et al. 2001). The remaining ancestral nodes are not on the time-scale. (A) Evolution of the HOX family genes. For ancestral nodes α, β, γ, δ, and ζ, the numbers in italic are the numbers of ancestral HOX genes estimated by other studies, and those above the italic are the estimated numbers in this study. Other studies are as follows: node α, Zhang and Nei (1996); node β, Holland and Garcia-Fernandez (1996); node γ, Wada et al. (2003); and nodes δ and ζ, Stellwag (1999). (B) Evolution of the entire homeobox gene superfamily. The numbers of gained and lost genes for the exterior branches are not so reliable (see Results). The notations used are the same as those of (A).
Fig. 4
Fig. 4
Estimated numbers of ancestral, gained, and lost genes during the evolution of bilateral animals when the Ecdysozoa tree is used. The notations used are the same as those in figure 3.

Similar articles

Cited by

References

    1. Abdelkhalek HB, Beckers A, Schuster-Gossler K, et al. The mouse homeobox gene Not is required for caudal notochord development and affected by the truncate mutation. Genes Dev. 2004;18:1725–1736. (14 co-authors). - PMC - PubMed
    1. Aguinaldo AM, Turbeville JM, Linford LS, Rivera MC, Garey JR, Raff RA, Lake JA. Evidence for a clade of nematodes, arthropods and other moulting animals. Nature. 1997;387:489–493. - PubMed
    1. Altschul SF, Madden TL, Schaffer AA, Zhang J, Zhang Z, Miller W, Lipman DJ. Gapped BLAST and PSI-BLAST: a new generation of protein database search programs. Nucleic Acids Res. 1997;25:3389–3402. - PMC - PubMed
    1. Amores A, Suzuki T, Yan YL, Pomeroy J, Singer A, Amemiya C, Postlethwait JH. Developmental roles of pufferfish Hox clusters and genome evolution in ray-fin fish. Genome Res. 2004;14:1–10. - PMC - PubMed
    1. Aparicio S, Hawker K, Cottage A, Mikawa Y, Zuo L, Venkatesh B, Chen E, Krumlauf R, Brenner S. Organization of the Fugu rubripes Hox clusters: evidence for continuing evolution of vertebrate Hox complexes. Nat Genet. 1997;16:79–83. - PubMed

Publication types