. 2005 Aug 3;25(31):7199-209.
doi: 10.1523/JNEUROSCI.1779-05.2005.

The mRNA for elongation factor 1alpha is localized in dendrites and translated in response to treatments that induce long-term depression

Affiliations

The mRNA for elongation factor 1alpha is localized in dendrites and translated in response to treatments that induce long-term depression

Fen Huang et al. J Neurosci. .

Abstract

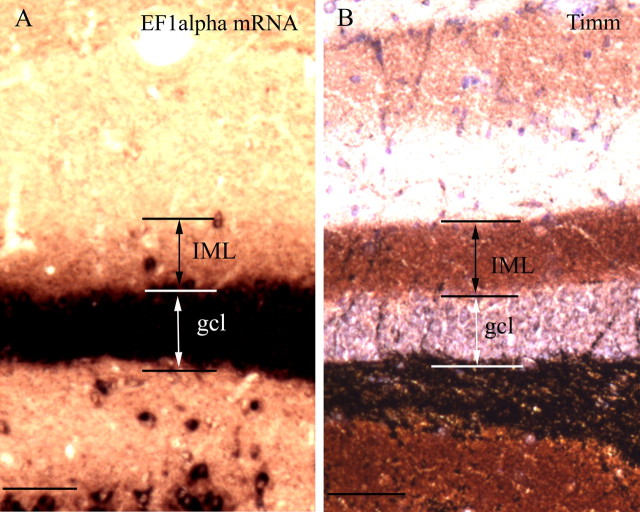
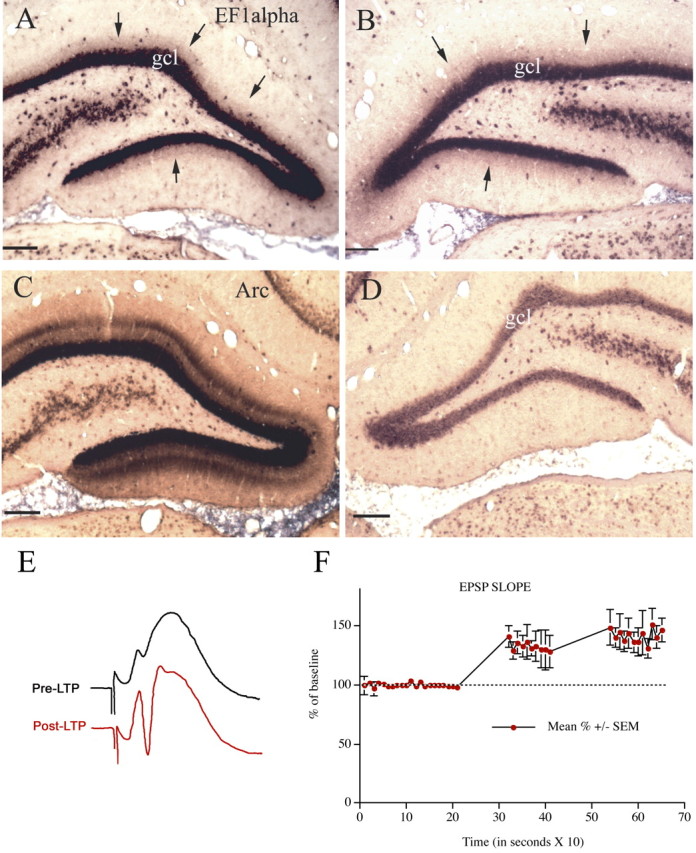
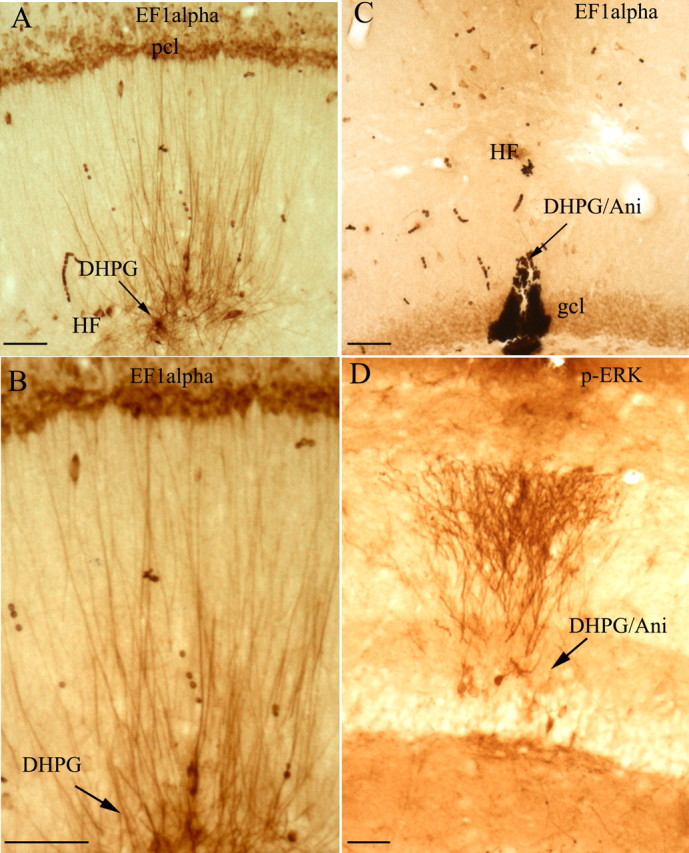
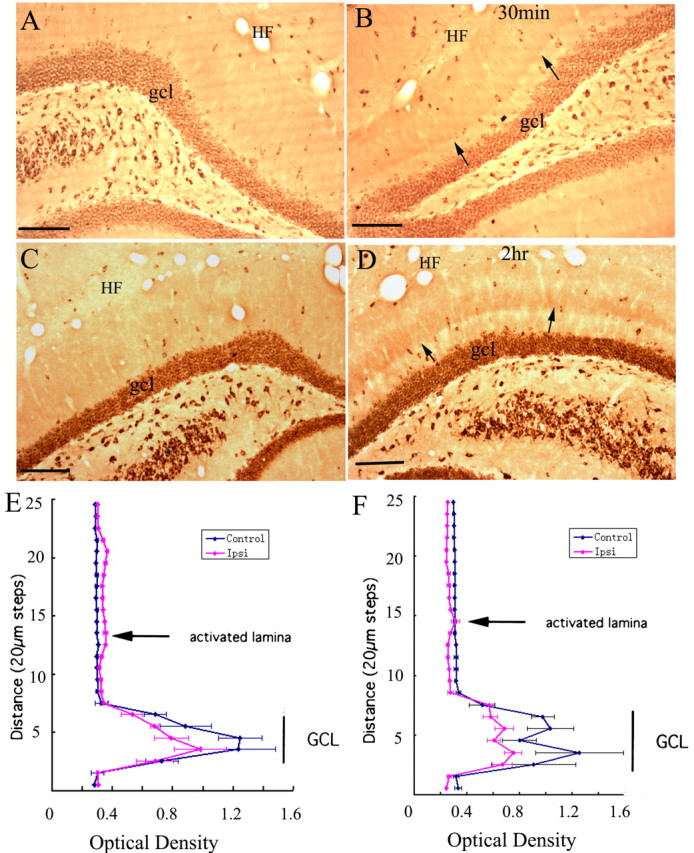
There is increasing evidence that long-lasting forms of activity-dependent synaptic plasticity, such as long-term potentiation (LTP) and long-term depression (LTD), require local synthesis of proteins within dendrites. Identifying novel dendritic mRNAs and determining how their distribution and translation is regulated is a high priority. We demonstrate here that the mRNA for the elongation factor 1 alpha (EF1alpha) is present in vivo in the dendrites of neurons that exhibit LTP and LTD, and that its translation is locally regulated. The subcellular distribution of EF1alpha mRNA differs from any of the dendritic mRNAs that have been described previously. In the hippocampus, the mRNA is highly expressed in cell bodies and is also concentrated in the zone of termination of commissural/associational afferents in the inner molecular layer, suggesting that mRNA localization is in some way related to the distribution of different types of synapses. Nevertheless, the localization of EF1alpha mRNA is not altered by prolonged periods of synaptic activation that are sufficient to cause a dramatic redistribution of Arc mRNA. Local application of the metabotropic glutamate receptor agonist (R,S)-3,5-dihydroxyphenylglycine (DHPG) led to dramatic increases in immunostaining for EF1alpha protein in dendrites, and treatment of hippocampal slices with DHPG, which is known to induce LTD, led to increases in EF1alpha protein levels. Both responses were blocked by the protein synthesis inhibitor anisomycin. In contrast, stimulation of the perforant path using patterns of stimulation that induce LTP caused rapid increases of immunostaining for EF1alpha protein in the activated dendritic lamina, but these increases were not blocked by anisomycin or rapamycin. The findings suggest that local synthesis of EF1alpha protein may be important for the synaptic mechanisms that underlie protein synthesis-dependent LTD.


Figures

Figure 1.
Figure 1.
EF1α mRNA distribution in the brain. A, Overall pattern of labeling in a sagittal section of mouse brain. The panel on the right illustrates a Northern blot showing the specificity of the cRNA probe. B-D illustrate the pattern of labeling in various regions in a coronal section of rat brain. B, Cortex; C, amygdala and surrounding piriform cortex; D, thalamus; E, cortex layer V neurons. Note labeled apical dendrites extending toward the cortical surface. F, Cerebellum. Note band of labeling in the inner portion of the molecular layer (which contains the proximal dendrites of cerebellar Purkinje cells). Letters in B indicate cortical layers. AMYG, Amygdala; PC, piriform cortex; PCL, Purkinje cell layer; GCL, granule cell layer; ML, molecular layer.
Figure 2.
Figure 2.
EF1α mRNA expression in hippocampus. A, Overall pattern of EF1α mRNA expression in the hippocampus. B-D, Higher-magnification pictures of the different regions of hippocampus. B, Dentate gyrus; C, CA1 region; D, CA3 region. E-H, Illustrate EF1α mRNA distribution during development in mice. E, Postnatal 10 d; F, postnatal day 15; G, postnatal day 25; H, postnatal day 39. DG, Dentate gyrus; pcl, pyramidal cell layer; gcl, granule cell layer; SR, stratum radiatum; ml, molecular layer. Small arrows in B indicate the sharp boundary of labeling at the boundary between the inner and middle molecular layers.
Figure 3.
Figure 3.
EF1α mRNA is concentrated in the inner molecular layer in dentate gyrus. A, EF1α mRNA distribution in adult dentate gyrus. Arrows and bars indicate the higher levels of labeling for EF1α mRNA in the inner molecular layer. B, Section stained by the Timm's sulfide silver technique, illustrating the labeling pattern in the molecular layer of the dentate gyrus. The heavily labeled band in the inner molecular layer corresponds to the site of termination of the commissural/associational system (Haug, 1974). IML, Inner molecular layer; gcl, granule cell layer. Scale bars, 50 μm.
Figure 4.
Figure 4.
EF1α mRNA distribution is not altered after prolonged periods of high-frequency stimulation of the perforant pathway. A, EF1α mRNA distribution in the dentate gyrus after 2 h of high-frequency stimulation of the perforant pathway. B, EF1α mRNA distribution on the side contralateral to the stimulation. C, Arc mRNA expression in the stimulated dentate gyrus. Arrow points out the activated dendritic lamina. D, Arc mRNA expression on the control side. Small arrows in A and B indicate the sharp boundary of labeling at the boundary between the inner and middle molecular layers. Scale bars, 100 μm. E, Illustrates perforant path evoked responses before (Pre-LTP) and after (Post-LTP) the third bout of 10 high-frequency trains. After determining the degree of potentiation, trains were delivered at a rate of formula image for 2 h. F, The graph illustrates the average ± SEM EPSP potentiation seen in three representative animals that are illustrated in subsequent figures. gcl, Granule cell layer.
Figure 5.
Figure 5.
Local application of DHPG triggers a dramatic increase in EF1α protein levels in dendrites. A, The photomicrograph illustrates the striking increases in immunostaining for EF1α protein in dendrites surrounding a DHPG-filled micropipette (30 min after placement of the micropipette). B, High-power view of EF1α protein increase in the dendrites, which shows increased staining of dendrites with minimal if any increases in immunostaining at the level of the cell body, documenting that the increases in EF1α protein occur locally in dendrites. C, Increases in immunostaining for EF1α are blocked by systemic injection of the protein synthesis of anisomycin. Note the complete lack of any increase in dendritic staining in the area surrounding the micropipette. D, As a positive control for the efficacy of DHPG, a nearby section was immunostained for p-ERK. Note striking increases in p-ERK staining in the area surrounding the DHPG-filled micropipette in the DHPG/anisomycin experiment. Arrows indicate the path of the DHPG-filled micropipette. Scale bars, 50 μm. DHPG/Ani, DHPG/anisomycin; gcl, granule cell layer; HF, hippocampal fissure; pcl, pyramidal cell layer.
Figure 6.
Figure 6.
DHPG treatment of hippocampal slices triggers rapid increases in EF1α protein synthesis and no overall protein synthesis increase by measuring 3H-leucine incorporation autoradiographically. A, Western blot illustrating levels of EF1α, p-ERK, and ERK in DHGP-treated and control hippocampal slices. B, 3H incorporation in the DHPG diffusion area in the CA1 region. C, EF1α protein increase in the dendrites of CA1 in the DHPG diffusion area. Arrows point out the path of DHPG-filled micropipette. Scale bars, 50 μm.
Figure 7.
Figure 7.
High-frequency stimulation of the medial perforant pathway alters immunostaining patterns for EF1α in the activated dentate gyrus. A, Pattern of immunostaining in the dentate gyrus on the side contralateral to the stimulation. B, Pattern of immunostaining after 30 min of high-frequency stimulation of the perforant path; small arrows indicate the band of increased immunostaining in the middle molecular layer (the site of termination of the medial perforant path). C, Pattern of immunostaining for EF1α on the control side of an animal that received 2 h of high-frequency stimulation. D, Pattern of immunostaining after 2 h of high-frequency stimulation. The graphs in E plot the average OD of EF1α immunostaining across the molecular layer from the cases illustrated in A and B, after 30 min of high-frequency stimulation, and F is the case illustrated in C and D, after 2 h of high-frequency stimulation. Error bars indicate the SD of the five measurements at each level. HF, Hippocampal fissure; gcl, granule cell layer. Arrows point to the activated dendritic lamina. Scale bars, 100 μm.
Figure 8.
Figure 8.
EF1α immunostaining pattern alteration induced by LTP stimulation in the dentate gyrus is not blocked by the protein synthesis inhibitors anisomycin or rapamycin. A and B illustrate EF1α immunostaining on the control side (A) and on the stimulated side (B) with anisomycin in the micropipette. Small arrows indicate the band of increased immunostaining. C and D illustrate c-fos immunostaining on the control side (C) and stimulated side (D). Arrows indicate regions in which c-fos immunostaining is increased; arrowheads indicate the area of blockade in which c-fos is present at control levels. E and F illustrate EF1α immunostaining on the control side (E) and stimulated side (F) with rapamycin injection. G and H illustrate immunostaining for p-S6 on the control side (G) and the stimulated side (H) with rapamycin injection. Arrows indicate cells exhibiting increased immunostaining for p-S6; arrowheads indicate the site of rapamycin injection. Ani, Anisomycin; gcl, granule cell layer; Rap, rapamycin. Scale bars, 100 μm.
Figure 9.
Figure 9.
EF1α immunostaining increase in the activated dendritic lamina induced by LTP stimulation is blocked by the actin polymerization inhibitor latrunculin B. A-D show the immunostaining for EF1α. A and C illustrate the side contralateral to the high-frequency stimulation. B and D illustrate the stimulated side with latrunculin B drug application. Arrows indicate the band of increased EF1α immunostaining in the stimulated dentate gyrus; arrowheads point out the blockade of the band by latrunculin B. E-H show the phalloidin staining of F-actin with a section close to the section shown in B. Arrows indicate the band of increased F-actin in the stimulated dentate gyrus; arrowheads point out the blockade of the band by latrunculin B. I and J show the phalloidin staining of F-actin with brain sections that received LTP stimulation with only saline in the electrode. The presence of the saline electrode has no effect on the band of the F-actin, as indicated by the arrows. gcl, Granule cell layer; Latr, latrunculin B. Scale bars, 100 μm.

Comment in

  • A TOP at the Synapse.
    Antion MD. Antion MD. J Neurosci. 2005 Oct 26;25(43):9823-4. doi: 10.1523/JNEUROSCI.3612-05.2005. J Neurosci. 2005. PMID: 16251429 Free PMC article. No abstract available.

References

    1. Bailey CH, Bartsch D, Kandel ER (1996) Toward a molecular definition of long-term memory storage. Proc Natl Acad Sci USA 93: 13445-13452. - PMC - PubMed
    1. Bailey CH, Kandel ER, Si K (2004) The persistence of long-term memory—a molecular approach to self-sustaining changes in learning-induced synaptic growth. Neuron 44: 49-57. - PubMed
    1. Berkeley JL, Levey AI (2003) Cell-specific extracellular signal-regulated kinase activation by multiple G protein-coupled receptor families in hippocampus. Mol Pharmacol 63: 128-135. - PubMed
    1. Bliss TV, Collinridge GL (1993) A synaptic model of memory: long-term potentiation in the hippocampus. Nature 361: 31-39. - PubMed
    1. Camodeca N, Breakwell NA, Rowan MJ, Anwyl R (1999) Induction of LTD by activation of group I mGluR in the dentate gyrus in vitro. Neuropharmacology 38: 1579-1606. - PubMed

Publication types

MeSH terms

LinkOut - more resources