. 2005 Aug 3;25(31):7278-87.
doi: 10.1523/JNEUROSCI.1879-05.2005.

Dendritic spine abnormalities in amyloid precursor protein transgenic mice demonstrated by gene transfer and intravital multiphoton microscopy

Affiliations

Dendritic spine abnormalities in amyloid precursor protein transgenic mice demonstrated by gene transfer and intravital multiphoton microscopy

Tara L Spires et al. J Neurosci. .

Abstract

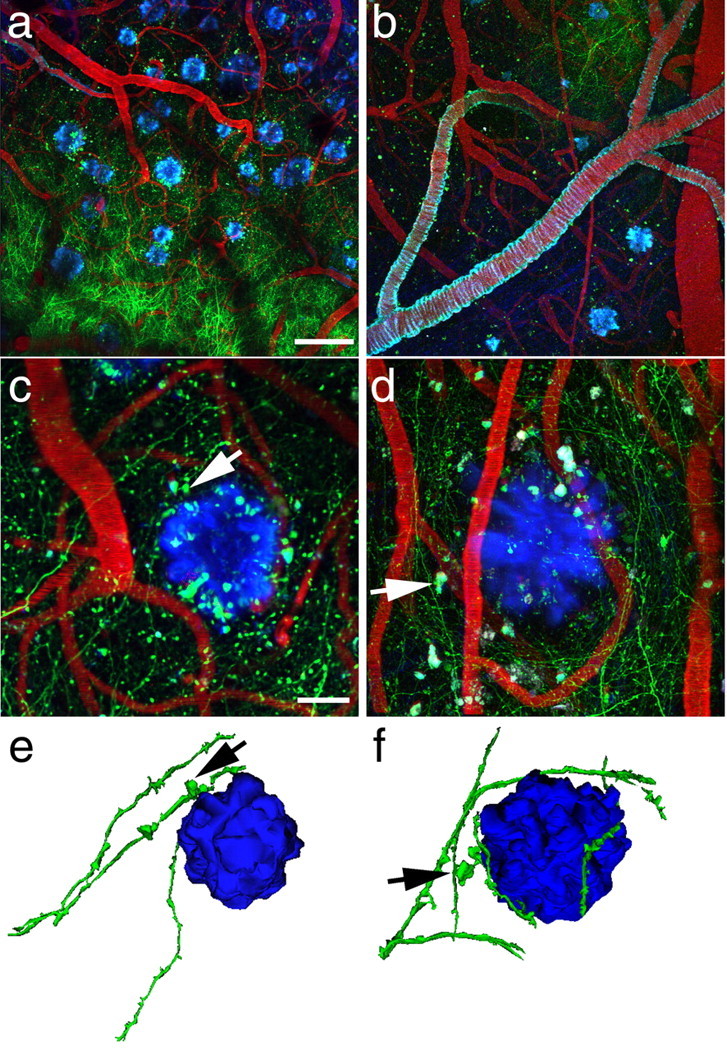
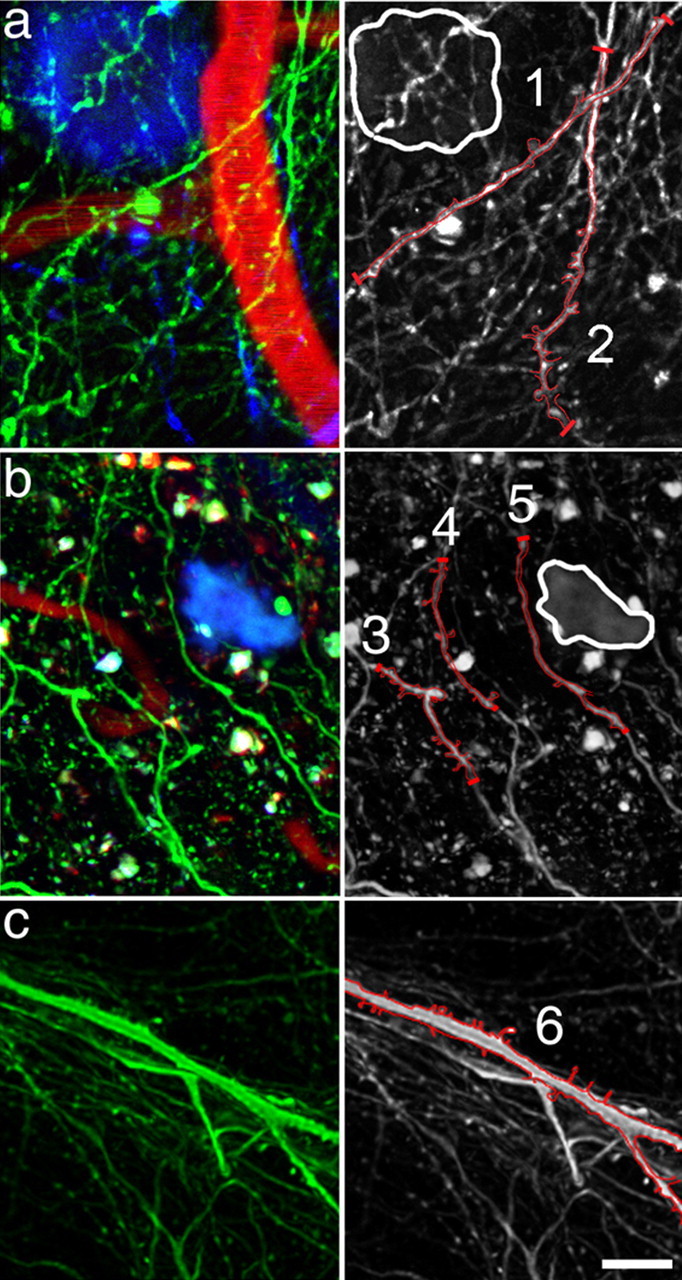
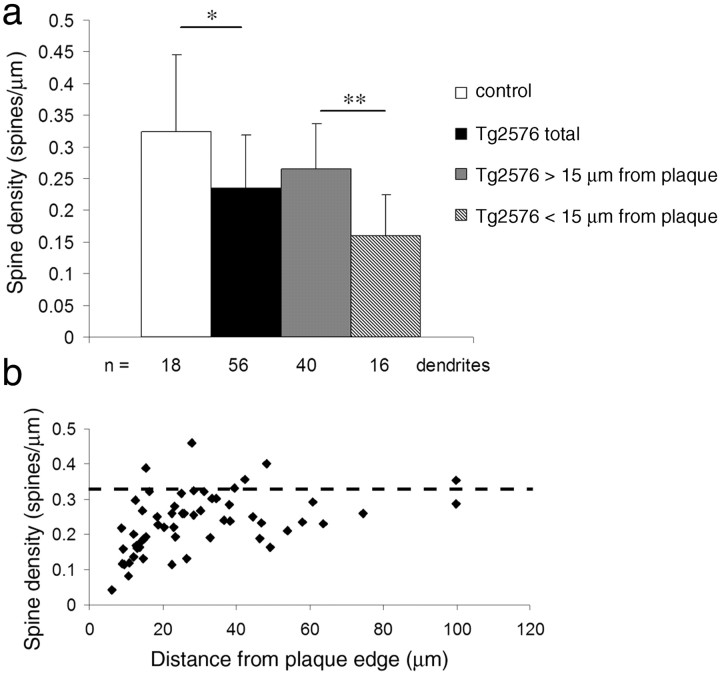
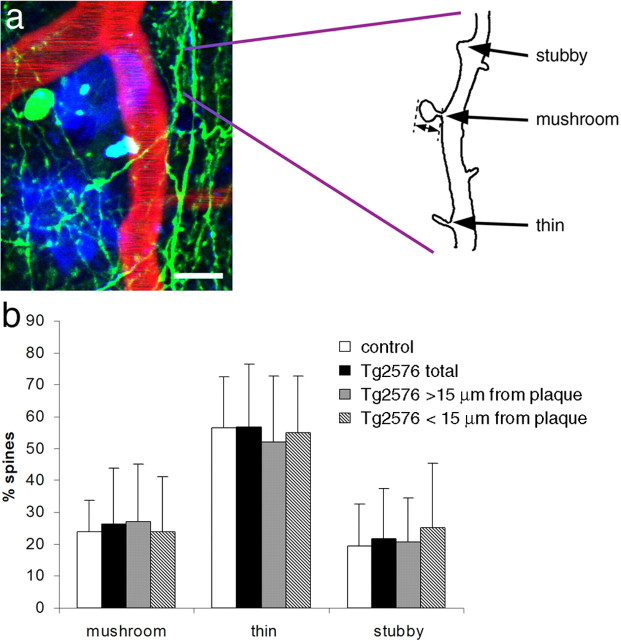
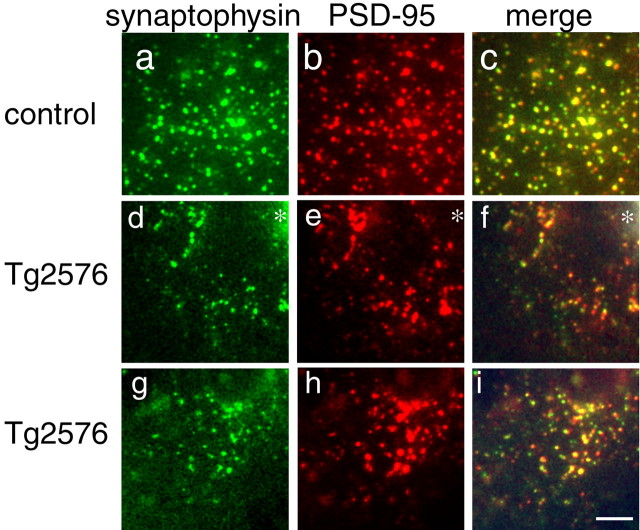
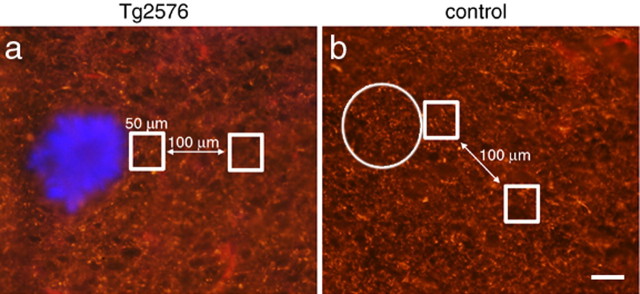
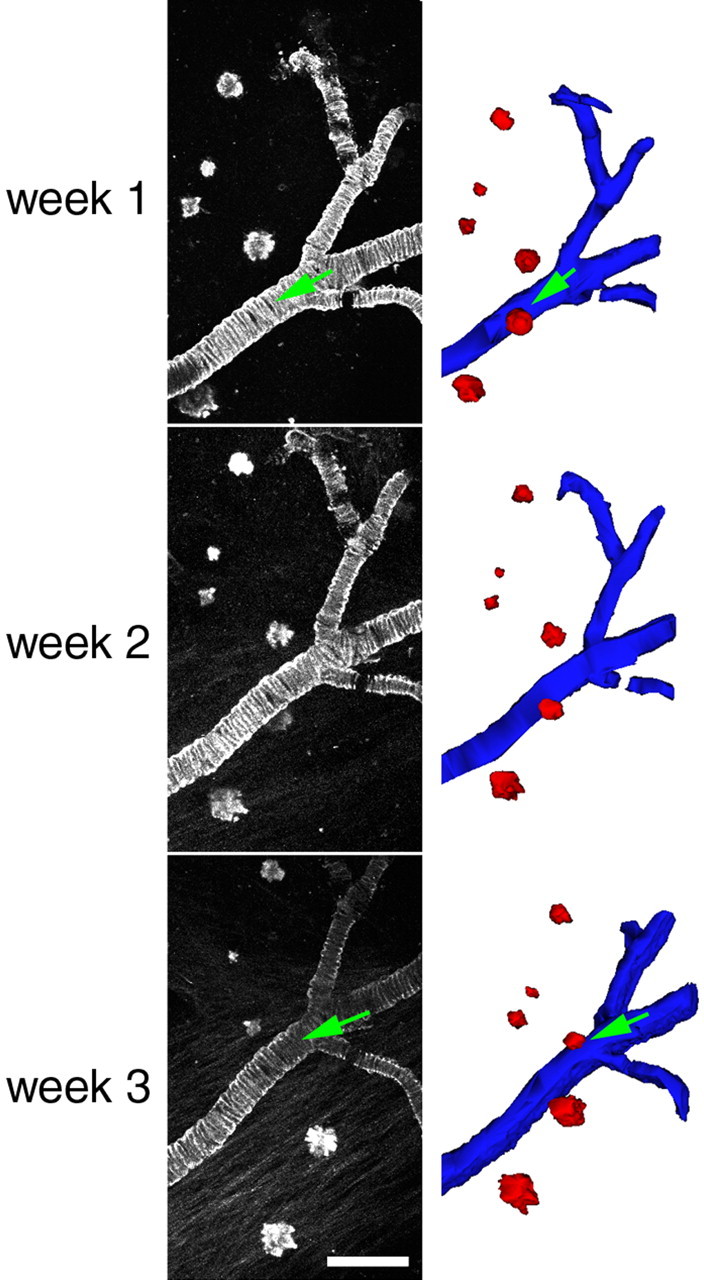
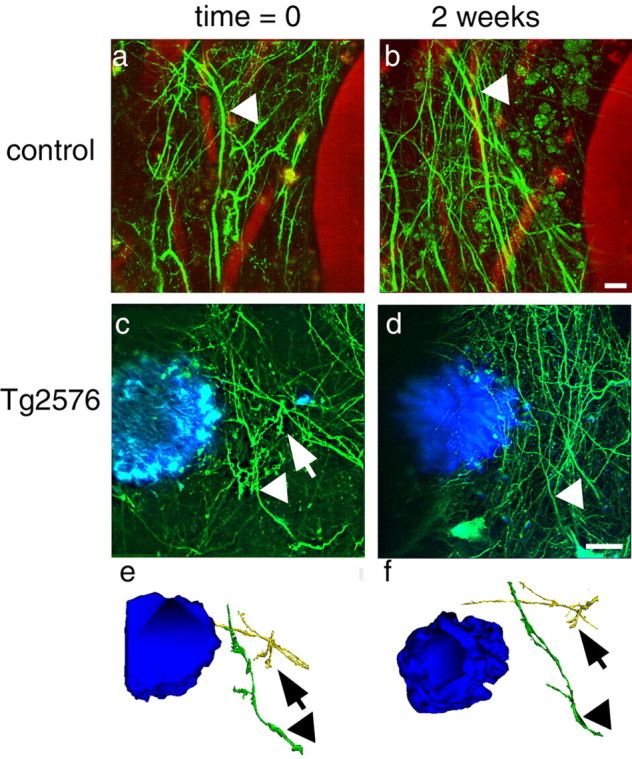
Accumulation of amyloid-beta (Abeta) into senile plaques in Alzheimer's disease (AD) is a hallmark neuropathological feature of the disorder, which likely contributes to alterations in neuronal structure and function. Recent work has revealed changes in neurite architecture associated with plaques and functional changes in cortical signaling in amyloid precursor protein (APP) expressing mouse models of AD. Here we developed a method using gene transfer techniques to introduce green fluorescent protein (GFP) into neurons, allowing the investigation of neuronal processes in the vicinity of plaques. Multiphoton imaging of GFP-labeled neurons in living Tg2576 APP mice revealed disrupted neurite trajectories and reductions in dendritic spine density compared with age-matched control mice. A profound deficit in spine density (approximately 50%) extends approximately 20 mum from plaque edges. Importantly, a robust decrement (approximately 25%) also occurs on dendrites not associated with plaques, suggesting widespread loss of postsynaptic apparatus. Plaques and dendrites remained stable over the course of weeks of imaging. Postmortem analysis of axonal immunostaining and colocalization of synaptophysin and postsynaptic density 95 protein staining around plaques indicate a parallel loss of presynaptic and postsynaptic partners. These results show considerable changes in dendrites and dendritic spines in APP transgenic mice, demonstrating a dramatic synaptotoxic effect of dense-cored plaques. Decreased spine density will likely contribute to altered neural system function and behavioral impairments observed in Tg2576 mice.


Figures

Figure 1.
Figure 1.
Amyloid plaques alter the morphology and trajectory of neurites in vivo. Low-magnification images (a, b) provide an overview of the GFP-AAV injection site containing GFP-filled neurites (green), blood vessels containing Texas Red, and amyloid deposition stained with methoxy-XO4 (blue). The angiogram, plaques, and cerebral amyloid angiopathy (seen coating a large vessel in b) are easily identified from week to week, allowing reimaging of the same sites over different imaging sessions. At higher magnification (c, d), we observe dystrophic neurites (arrows) associated with plaques. We also confirm that dendrites do not penetrate plaques; rather their trajectory curves around plaque edges. Three-dimensional reconstructions of plaques and neurites (e, f) clearly show this curvature around plaques and highlight dystrophies near plaques (arrows). Scale bars: a, b, 100 μm; c, d, 20 μm.
Figure 2.
Figure 2.
Dendrites in close proximity to plaques exhibit reduced spine density. Analysis of dendritic spine density in high-resolution multiphoton images of Tg2576 cortex (examples shown in a, b) revealed a decrease in dendritic spine density on dendrites within 15 μm of a plaque edge and an overall decrease in spine density when compared with nontransgenic control mice (example shown in c). The left column shows three-channel images with neurites (green), plaques (blue), and blood vessels (red). The right column shows only the neurites, some of which have been outlined in red on the 2D projection to show the dendritic spines. Dendrite 1, which is within 15 μm of a plaque edge (outlined in white), has a lower spine density than dendrite 2, which is farther away from the plaque. Interestingly, the spine density on dendrite 2 is lower at the top, which is nearer to the plaque. Similarly, in b, dendrites 3 and 4 have more spines than dendrite 5, which is closest to the plaque. Dendrite 6 is a spiny dendrite from a nontransgenic mouse. Scale bar, 10 μm.
Figure 3.
Figure 3.
Dendritic spine loss is most pronounced near amyloid plaques. Analysis of dendritic spine density in 12 Tg2576 and four control animals shows an overall reduction of 27.7% in Tg2576 cortex compared with control. Spine loss is even more dramatic near plaques, with a 54.3% decrease in spine density within 15 μm of a plaque edge compared with control and a 37.5% decrease compared with dendrites farther from plaques (a). Spine densities are reported as the mean ± SD from the mean (*p = 0.0008, ANOVA, F(1,72) = 12.371; **p < 0.0001, Bonferroni's post hoc test). A scatter plot of spine density data from Tg2576 mice (b) shows a positive correlation between density and distance from a plaque (Pearson's correlation coefficient, 0.411; p = 0.0015). Even at great distances from a plaque edge, dendritic spine density is reduced compared with control density (dotted line).
Figure 4.
Figure 4.
Dendritic spine length and morphology are not affected by amyloid plaques. Dendritic spines were analyzed on tracings of dendrite segments (a). The length of each dendritic spine was measured from the base, at which it meets the dendritic shaft to the spine tip (double-headed arrow). Spines were classified by morphology as mushroom, thin, or stubby (examples shown in a). There was no effect of the APP transgene or proximity to dense-cored plaques on the proportion of spines with each morphology (b). Scale bar, 10 μm.
Figure 5.
Figure 5.
Spine loss reflects loss of excitatory synapses. Immunostaining for synaptophysin (a, d, g) and PSD-95 (b, e, h) reveals similar levels of colocalization (c, f, i) of these presynaptic and postsynaptic markers in control cortex, Tg2576 cortex near the edge of dense plaques (asterisks in d-f), and in Tg2576 cortex distant from plaques (g-i). Similar amounts of colocalization indicate that dendritic spine loss in Tg2576 cortex is accompanied by loss of the presynaptic element and not retraction of spines leaving a solitary presynaptic element. There are also qualitatively fewer synapses in Tg2576 cortex near plaques than in control, implying a loss of excitatory synapses concomitant with spine loss. Scale bar, 5 μm.
Figure 6.
Figure 6.
Axon density is not reduced near plaques. SMI312-positive axon immunoreactivity was quantified in Tg2576 cortex and control cortex. The ratio of staining intensity was compared in a 50 × 50 μm square region of interest adjacent to a plaque (stained blue with thioflavine S) and in an identical region 100 μm away. In control images, SMI312 immunoreactivity was measured adjacent to a phantom plaque (circle) and a site 100 μm away. There is no difference in this ratio between Tg2576 (a) and control cortex (b). In both conditions, the ratio is very close to 1 (1.03 ± 0.10 in Tg2576 cortex; 1.05 ± 0.05 in control cortex), indicating no difference in SMI32-positive axon density near plaques. Scale bar, 50 μm.
Figure 7.
Figure 7.
Dense-cored amyloid plaques are stable over time in 21- to 23-month-old Tg2576 mice. Most plaques observed did not change over the course of weeks. Cross-sectional area of plaques varied widely, as seen in the examples above. Individual plaques followed over 1 week did not significantly change size (n = 169 plaques). Three-dimensional reconstruction of plaques (red) and cerebral amyloid angiopathy (blue) allowed rotation of the data sets in three dimensions and ensured that errors in analysis attributable to obstruction of plaques in 2D projections (green arrows) would not occur. Scale bar, 100 μm.
Figure 8.
Figure 8.
Dendrites are stable over time in control (a, b) and Tg2576 (c, d) cortex. The same dendrites could be identified in different weekly imaging sessions (arrowheads). In 2D projections of image stacks, some dendrites seemed to disappear over the course of 2 weeks (arrows), but examination of 3D reconstructions always showed that the dendrites were still present (e, f). Scale bars, 10 μm.

References

    1. Bacskai BJ, Kajdasz ST, McLellan ME, Games D, Seubert P, Schenk D, Hyman BT (2002) Non-Fc-mediated mechanisms are involved in clearance of amyloid-β in vivo by immunotherapy. J Neurosci 22: 7873-7878. - PMC - PubMed
    1. Benzing WC, Mufson EJ, Armstrong DM (1993) Alzheimer's disease-like dystrophic neurites characteristically associated with senile plaques are not found within other neurodegenerative diseases unless amyloid beta-protein deposition is present. Brain Res 606: 10-18. - PubMed
    1. Berezovska O, Frosch M, McLean P, Knowles R, Koo E, Kang D, Shen J, Lu FM, Lux SE, Tonegawa S, Hyman BT (1999) The Alzheimer-related gene presenilin 1 facilitates notch 1 in primary mammalian neurons. Brain Res Mol Brain Res 69: 273-280. - PubMed
    1. Boncristiano S, Calhoun ME, Howard V, Bondolfi L, Kaeser SA, Wiederhold KH, Staufenbiel M, Jucker M (2005) Neocortical synaptic bouton number is maintained despite robust amyloid deposition in APP23 transgenic mice. Neurobiol Aging 26: 607-613. - PubMed
    1. Brendza RP, Simmons K, Bales KR, Paul SM, Goldberg MP, Holtzman DM (2003a) Use of YFP to study amyloid-beta associated neurite alterations in live brain slices. Neurobiol Aging 24: 1071-1077. - PubMed

Publication types

MeSH terms

LinkOut - more resources