

A high-density SNP genomewide linkage scan for chronic lymphocytic leukemia-susceptibility loci
- PMID: 16080117
- PMCID: PMC1226207
- DOI: 10.1086/444472
A high-density SNP genomewide linkage scan for chronic lymphocytic leukemia-susceptibility loci
Abstract
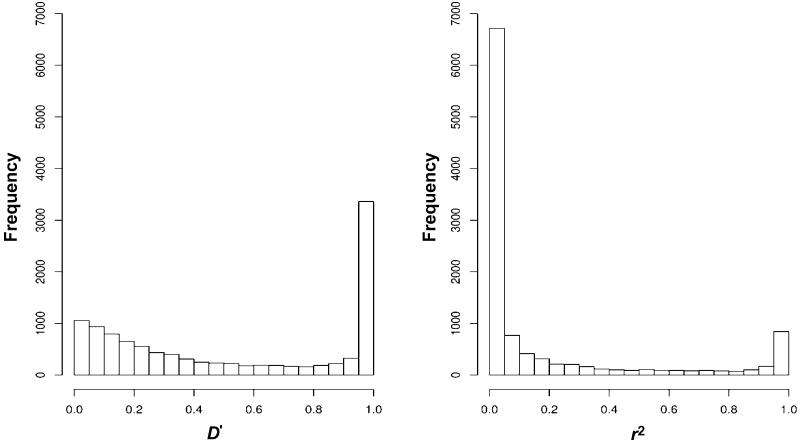
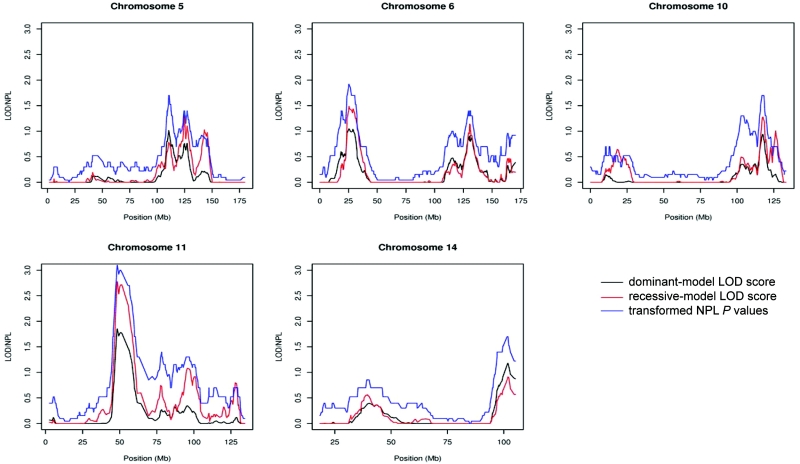
Chronic lymphocytic leukemia (CLL) and other B-cell lymphoproliferative disorders (LPDs) show clear evidence of familial aggregation, but the inherited basis is largely unknown. To identify a susceptibility gene for CLL, we conducted a genomewide linkage analysis of 115 pedigrees, using a high-density single-nucleotide polymorphism (SNP) array containing 11,560 markers. Multipoint linkage analyses were undertaken using both nonparametric (model-free) and parametric (model-based) methods. Our results confirm that the presence of high linkage disequilibrium (LD) between SNP markers can lead to inflated nonparametric linkage (NPL) and LOD scores. After the removal of high-LD SNPs, we obtained a maximum NPL of 3.14 (P=.0008) on chromosome 11p11. The same genomic position also yielded the highest multipoint heterogeneity LOD (HLOD) score under both dominant (HLOD 1.95) and recessive (HLOD 2.78) models. In addition, four other chromosomal positions (5q22-23, 6p22, 10q25, and 14q32) displayed HLOD scores >1.15 (which corresponds to a nominal P value <.01). None of the regions coincided with areas of common chromosomal abnormalities frequently observed for CLL. These findings strengthen the argument for an inherited predisposition to CLL and related B-cell LPDs.
Figures


References
Web Resources
-
- Affymetrix NetAffx, http://www.affymetrix.com/analysis/index.affx
-
- Online Mendelian Inheritance in Man (OMIM), http://www.ncbi.nlm.nih.gov/Omim/ (for CLL, NHL, HL, and AT)
-
- University of California–Santa Cruz Human Genome Browser, http://genome.ucsc.edu/cgi-bin/hgGateway
References
-
- Abecasis GR, Cherny SS, Cookson WO, Cardon LR (2002) Merlin—rapid analysis of dense genetic maps using sparse gene flow trees. Nat Genet 30:97–101 - PubMed
-
- Bevan S, Catovsky D, Marossy A, Matutes A, Popat S, Antonovic P, Bell A, Berrebi A, Gaminara E, Quabeck K, Ribeiro I, Mauro FR, Stark P, Sykes H, van Dongen J, Wimperis J, Wright S, Yuille MR, Houlston RS (1999) Linkage analysis for ATM in familial B cell chronic lymphocytic leukaemia. Leukemia 13:1497–1500 - PubMed
-
- Devlin B, Risch N (1995) A comparison of linkage disequilibrium measure for fine-scale mapping. Genomics 29:311–322 - PubMed
Publication types
MeSH terms
LinkOut - more resources
Full Text Sources
Molecular Biology Databases
Research Materials
