. 2005 Oct 15;568(Pt 2):423-43.
doi: 10.1113/jphysiol.2005.091264. Epub 2005 Aug 4.

Molecular mechanisms of regulation of fast-inactivating voltage-dependent transient outward K+ current in mouse heart by cell volume changes

Affiliations

Molecular mechanisms of regulation of fast-inactivating voltage-dependent transient outward K+ current in mouse heart by cell volume changes

Guan-Lei Wang et al. J Physiol. .

Abstract

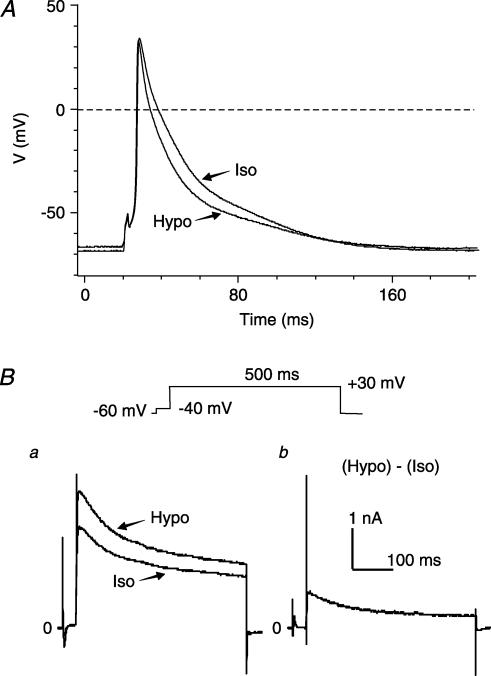
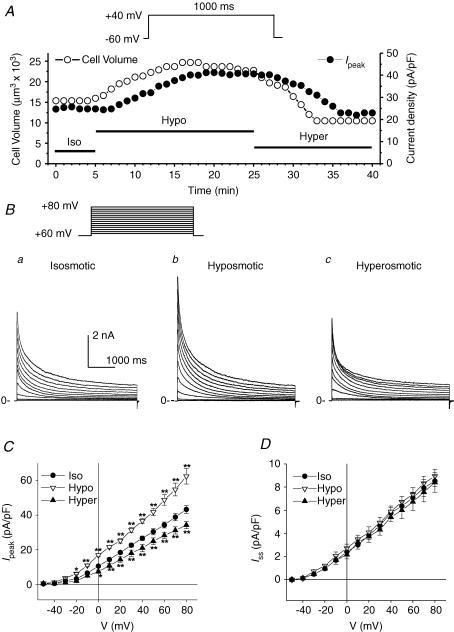
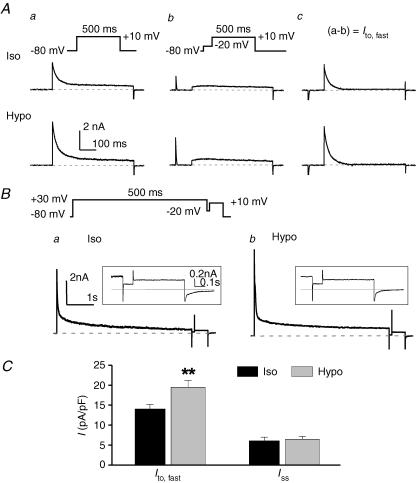
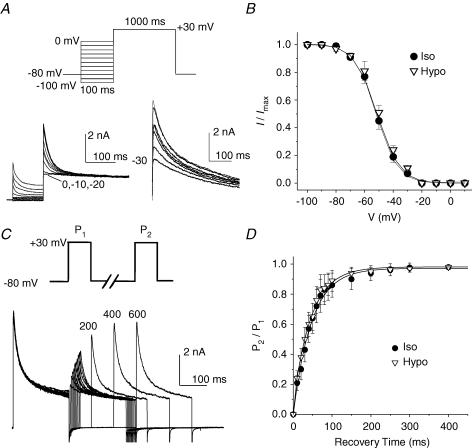
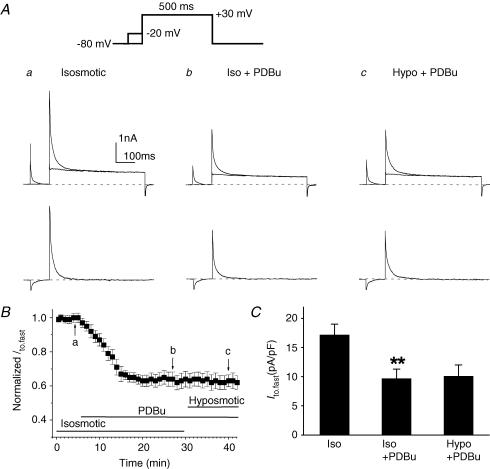
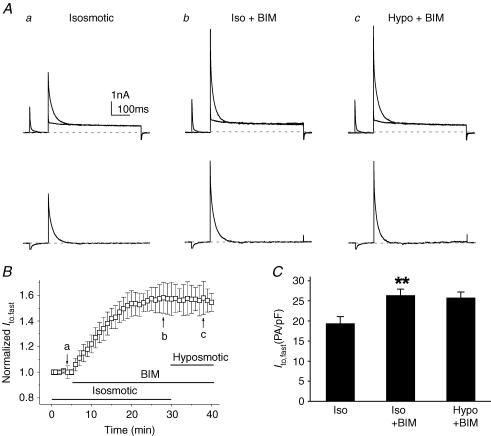
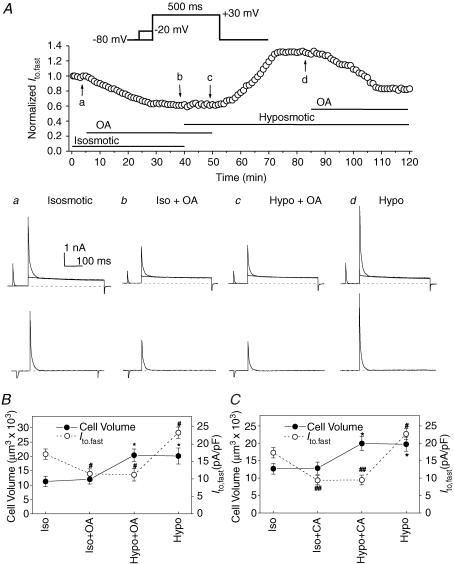
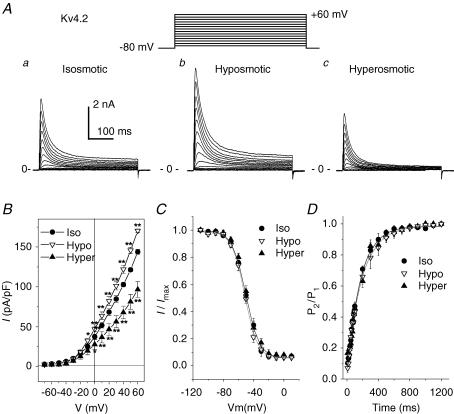
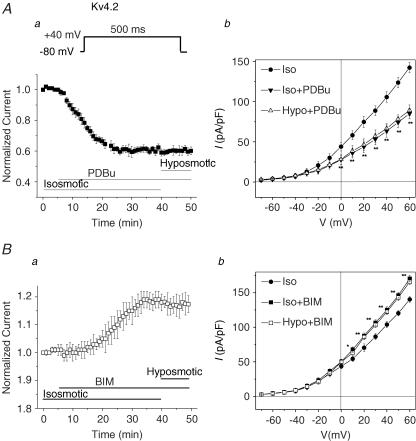
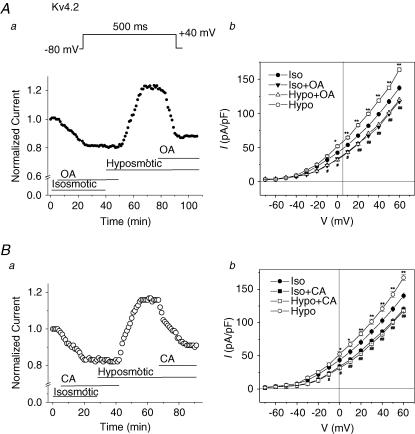
The K(v)4.2/4.3 channels are the primary subunits that contribute to the fast-inactivating, voltage-dependent transient outward K(+) current (I(to,fast)) in the heart. I(to,fast) is the critical determinant of the early repolarization of the cardiac action potential and plays an important role in the adaptive remodelling of cardiac myocytes, which usually causes cell volume changes, during myocardial ischaemia, hypertrophy and heart failure. It is not known, however, whether I(to,fast) is regulated by cell volume changes. In this study we investigated the molecular mechanism for cell volume regulation of I(to,fast) in native mouse left ventricular myocytes. Hyposmotic cell swelling caused a marked increase in densities of the peak I(to,fast) and a significant shortening in phase 1 repolarization of the action potential duration. The voltage-dependent gating properties of I(to,fast) were, however, not altered by changes in cell volume. In the presence of either protein kinase C (PKC) activator (12,13-dibutyrate) or phosphatase inhibitors (calyculin A and okadaic acid), hyposmotic cell swelling failed to further up-regulate I(to,fast). When expressed in NIH/3T3 cells, both K(v)4.2 and K(v)4.3 channels were also strongly regulated by cell volume in the same voltage-independent but PKC- and phosphatase-dependent manner as seen in I(to,fast) in the native cardiac myocytes. We conclude that K(v)4.2/4.3 channels in the heart are regulated by cell volume through a phosphorylation/dephosphorylation pathway mediated by PKC and serine/threonine phosphatase(s). These findings suggest a novel role of K(v)4.2/4.3 channels in the adaptive electrical and structural remodelling of cardiac myocytes in response to myocardial hypertrophy, ischaemia and reperfusion.


Figures

Figure 1
Figure 1. Osmotic regulation of APD and Ito in mouse left ventricular apex myocytes
A, superimposed representative action potential recordings under isosmotic (Iso, 305 mosmol kg−1) and hyposmotic (Hypo, 235 mosmol kg−1) conditions. B, original traces of whole-cell currents measured in the same cell as in panel A. a, superimposed representative whole-cell current traces recorded with the voltage protocols shown above, under isosmotic (Iso) and hyposmotic (Hypo) conditions. b, hyposmotic stress-sensitive current obtained by subtracting the current recorded under isosmotic (Iso) conditions from that under hyposmotic (Hypo) conditions.
Figure 2
Figure 2. Effects of osmotic stress on cell volume and transient outward K+ currents in mouse ventricular apex myocytes
A, representative time course of changes in cell volume (•, y-axis on the left) and peak transient outward K+ current density (•, y-axis on the right) in a single mouse ventricular myocyte under different osmotic conditions. Cell volume and the whole-cell outward currents elicited by a 1-s depolarizing voltage pulse to +40 mV from a holding potential of −60 mV were continuously monitored every 1 min when the cell was exposed to isosmotic (Iso), hyposmotic (Hypo) and hyperosmotic (Hyper) solutions, respectively. Similar results were observed in seven cells. B, families of whole-cell outward currents elicited by a series of 4.5-s depolarizing voltage steps from a holding potential of −60 mV to potentials between −50 and +80 mV in 10-mV increments (inset on top) under isosmotic (a), hyposmotic (b) and hyperosmotic (c) conditions. C and D, mean I–V curves for Ipeak and Iss in mouse apex myocytes (n = 12) under isosmotic, hyposmotic and hyperosmotic conditions. Ipeak was measured as the peak of outward currents (at 10–50 ms) and Iss was measured at the end of 4.5-s voltage steps. *P < 0.05, **P < 0.01 versus isosmotic conditions.
Figure 3
Figure 3. Hyposmotic cell swelling increases Ito,fast but not Iss in mouse left ventricular apex myocytes
A, effects of osmotic stress on Ito,fast. Whole-cell currents were recorded in the presence of 50 μm 4-AP from the same cell with voltage protocols shown on the top under isosmotic (Iso, upper traces) and hyposmotic (Hypo, lower traces) conditions. Cells were held at −80 mV, and currents were elicited by a 500-ms depolarizing voltage pulse to +10 mV (a) or by a 500-ms depolarizing step preceded by a 100-ms ‘inactivating’ prepulse to −20 mV to inactivate Ito,fast.(b). Ito,fast was measured from the prepulse-sensitive difference currents obtained by subtracting the currents in panel b from the currents in panel a (ab) under corresponding osmotic conditions (c). B, effects of hyposmotic cell swelling on Iss. The voltage protocol (shown on the top) consists of a 5-s, +30-mV step and a 0.75-s, +10-mV step, which is interposed by a 100-ms ‘inactivating’ prepulse at −20 mV. The membrane currents elicited by the depolarization step from −20 mV to +10 mV are Iss. Representative Iss recorded under isosmotic (Iso) and hyposmotic (Hypo) conditions are shown on expanded time and current scales in panels a and b. The dashed lines indicate zero current. Representative whole-cell current traces are shown in the inset. C, mean current densities of Ito,fast (Ac, n = 7) and Iss (B, n = 6) in mouse left ventricular apex myocytes under isosmotic (black bars) and hyposmotic (grey bars) conditions. **P < 0.01 versus isosmotic condition.
Figure 4
Figure 4. Effects of osmotic stress on voltage-dependent gating properties of Ito,fast in mouse ventricular apex myocytes
A, the voltage dependence of steady-state inactivation of Ito,fast. Outward K+ currents were recorded during 1-s depolarization to +30 mV after 100-ms prepulses to potentials between −100 and 0 mV (protocol shown on the top) in the presence of 50 μm 4-AP. The representative current traces recorded under hyposmotic conditions are shown on the left. The test pulse currents obtained with the −20, −10 and 0 mV prepulses were superimposed on each other. The difference currents were obtained by subtraction of the test pulse currents recorded with the −20-mV prepulse from those recorded with prepulses between −100 and 0 mV. No inactivating component was observed with prepulses of −20, −10 and 0 mV. Numbers next to current traces indicate the corresponding potential of the inactivating prepulse. B, mean steady-state voltage-dependent inactivation curve of Ito,fast under isosmotic and hyposmotic conditions (n = 6). Peak Ito,fast recorded at +30 mV was normalized to the corresponding current amplitude measured at −100 mV. C and D, effects of cell swelling on the recovery from inactivation of Ito,fast; C, representative current traces recorded using a double-pulse voltage protocol (shown on the top); D, recovery of Ito,fast from inactivation under isosmotic and hyposmotic conditions (n = 7).
Figure 5
Figure 5. Effects of PKC activator (PDBu) on Ito,fast in mouse left ventricular apex myocytes
A, representative current traces of Ito,fast (lower traces in each panel) obtained from the subtraction of currents recorded with the inactivating prepulse from those recorded without the inactivating prepulse (upper superimposed traces) in the presence of 50 μm 4-AP. Voltage protocols are shown on the top. The same cell was consecutively exposed to isosmotic solution (a), isosmotic + PDBu (100 nm, b), and hyposmotic + PDBu (100 nm, c). PDBu decreased Ito,fast under isosmotic conditions and subsequent hyposmotic perfusion failed to further activate Ito,fast. B, time course of changes in normalized Ito,fast at +30 mV when cells were exposed consecutively to isosmotic, isosmotic + PDBu, and hyposmotic + PDBu solutions. Peak Ito,fast was recorded every 1 min then normalized to the initial corresponding value at time 0 (n = 7). C, mean peak current densities of Ito,fast recorded when cells were exposed to isosmotic, isosmotic + PDBu, and hyposmotic + PDBu solutions. Currents were obtained using the protocols shown in panel A (n = 7). **P < 0.01 versus isosmotic (Iso) condition.
Figure 6
Figure 6. Effects of PKC inhibitor (BIM) on Ito,fast in mouse left ventricular apex myocytes
A, representative current traces of Ito,fast recorded from a ventricular myocyte using the same voltage protocols as shown in Fig. 5A in the presence of 50 μm 4-AP when the same cell was consecutively exposed to isosmotic (a), isosmotic + BIM (100 nm, b), and hyposmotic + BIM (c) solutions. B. time course of changes in normalized Ito,fast at +30 mV when cells were exposed consecutively to isosmotic, isosmotic + BIM, and hyposmotic + BIM solutions. The amplitudes of Ito,fast were recorded every 1 min and then normalized to the initial corresponding value at time 0 (n = 7). C, mean peak current densities of Ito,fast (n = 7) recorded at +30 mV when cells were exposed to isosmotic, isosmotic + BIM (Iso + BIM), and hyposmotic + BIM (Hypo + BIM) solutions using protocols shown in Fig. 5A. **P < 0.01 versus isosmotic (Iso) conditions.
Figure 7
Figure 7. Effects of serine/threonine protein phosphatase inhibitors, okadaic acid and calyculin A, on Ito,fast in mouse left ventricular myocytes
A, whole-cell currents were monitored continuously in the presence of 50 μm 4-AP (voltage-clamp protocols shown on the top, also see Fig. 3A for details). Top panel, Ito,fast was recorded every 1 min then normalized to the initial corresponding value at time 0 when cardiac myocytes were consecutively exposed to isosmotic, isosmotic + OA (100 nm), hyposmotic + OA (100 nm), and hyposmotic solutions. Changes in perfusion solutions were started when the changes in current amplitude reached the steady-state level. a–d, the representative superimposed current traces (upper) and the prepulse-sensitive difference current (Ito,fast) traces (lower) recorded from the same cell as shown in the top panel at the time points indicated by the arrows. B, changes in mean peak Ito,fast current densities (•, y-axis on the left) and cell volume (•, y-axis on the right) recorded when cells were consecutively exposed to isosmotic (Iso), isosmotic +100 nm OA (Iso + OA), hyposmotic +100 nm OA (Hypo + OA), and hyposmotic (Hypo) solutions (n = 6). Currents were obtained using the protocols described in panel A (*P < 0.05 when compared with cell volume under control (Iso) conditions; #P < 0.05 when compared with peak current density under control (Iso) conditions). C, changes in mean peak Ito,fast current densities (•) and cell volume (•) recorded from cardiac myocytes when they were consecutively exposed to isosmotic (Iso), isosmotic + 20 nm CA (Iso + CA), hyposmotic + 20 nm CA (Hypo + CA), and hyposmotic (Hypo) solutions (n = 5, *P < 0.05 when compared with cell volume under control (Iso) conditions; #P < 0.05, ##P < 0.01 when compared with peak current density under control (Iso) conditions).
Figure 8
Figure 8. Effects of osmotic stress on Kv4.2 channels in NIH/3T3 cells
A, representative whole-cell currents recorded from NIH/3T3 cells expressing the rat Kv4.2 gene under isosmotic (a), hyposmotic (b) and hyperosmotic (c) conditions. Kv4.2 currents were elicited by a series of 400-ms depolarizing voltage steps (inset). B, mean I–V curves of Kv4.2 channels (n = 12) recorded under isosmotic, hyposmotic and hyperosmotic conditions. C, mean steady-state voltage-dependent inactivation curves of Kv4.2 (n = 6) obtained from a double-pulse protocol (inset in A,) under isosmotic, hyposmotic and hyperosmotic conditions. D, recovery from inactivation was examined using a double-pulse protocol with different recovery times (see Methods). Mean normalized currents (n = 7) under isosmotic, hyposmotic and hyperosmotic conditions were plotted against recovery time. The kinetics of recovery from inactivation was a single exponential process (continuous lines) with a time constant (τ) of 303 ± 43, 317 ± 41 and 291 ± 38 ms (P > 0.05) under isosmotic, hyposmotic and hyperosmotic conditions, respectively.
Figure 9
Figure 9. Effects of PKC activator (PDBu) and inhibitor (BIM) on Kv4.2 currents in NIH/3T3 cells
A, effect of PDBu (100 nm) on peak Kv4.2 currents. a, time course of changes in normalized peak Kv4.2 currents (n = 6) measured at +40 mV under isosmotic, isosmotic + PDBu, and hyposmotic + PDBu conditions. b, I–V curves of Kv4.2 channels (n = 7) recorded using a protocol as described in Fig. 5 in isosmotic (Iso), isosmotic + PDBu (Iso + PDBu), and hyposmotic + PDBu (Hypo + PDBu) solutions. PDBu inhibited the currents under isosmotic conditions and prevented further activation by hyposmotic cell swelling. B, effects of BIM on Kv4.2 channels. a, time course of changes in normalized peak Kv4.2 currents recorded at +40 mV under isosmotic, isosmotic + BIM, and hyposmotic + BIM conditions (n = 5). b, mean I–V curves of Kv4.2 channels (n = 5) in isosmotic (Iso), isosmotic + BIM (Iso + BIM), and hyposmotic + BIM (Hypo + BIM) solutions. BIM caused a time-dependent increase in Kv4.2 currents even under isosmotic conditions and prevented further activation by hyposmotic cell swelling.
Figure 10
Figure 10. Effects of serine/threonine phosphatase inhibitors on volume regulation of Kv4.2 currents in NIH/3T3 cells
A, effect of OA (100 nm) on peak Kv4.2 currents. a, time course of changes in normalized peak Kv4.2 currents measured at +40 mV under isosmotic, isosmotic + OA, and hyposmotic + OA conditions. b, I–V curves of Kv4.2 channels (n = 5) recorded using a protocol as described in Fig. 5 in isosmotic (Iso), isosmotic + OA (Iso + PDBu), and hyposmotic + OA (Hypo + OA) solutions. OA inhibited the currents under isosmotic conditions and prevented further activation by hyposmotic cell swelling. B, effects of CA (20 nm) on Kv4.2 channels. a, time course of changes in normalized peak Kv4.2 currents recorded at +40 mV under isosmotic, isosmotic + CA, and hyposmotic + CA conditions. b, mean I–V curves of Kv4.2 channels (n = 5) in isosmotic (Iso), isosmotic + CA (Iso + CA), and hyposmotic + CA (Hypo + BIM) solutions. CA inhibited the currents under isosmotic conditions and prevented further activation by hyposmotic cell swelling.

Similar articles

Cited by

References

    1. Barry DM, Xu H, Schuessler RB, Nerbonne JM. Functional knockout of the transient outward current, long-QT syndrome, and cardiac remodeling in mice expressing a dominant-negative Kv4 alpha subunit. Circ Res. 1998;83:560–567. - PubMed
    1. Baumgarten CM, Clemo HF. Swelling-activated chloride channels in cardiac physiology and pathophysiology. Prog Biophys Mol Biol. 2003;82:25–42. - PubMed
    1. Befroy DE, Powell T, Radda GK, Clarke K. Osmotic shock: modulation of contractile function, pHi, and ischemic damage in perfused guinea pig heart. Am J Physiol. 1999;276:H1236–H1244. - PubMed
    1. Brouillette J, Clark RB, Giles WR, Fiset C. Functional properties of K+ currents in adult mouse ventricular myocytes. J Physiol. 2004;559:777–798. - PMC - PubMed
    1. Brunet S, Aimond F, Li H, Guo W, Eldstrom J, Fedida D, Yamada KA, Nerbonne JM. Heterogeneous expression of repolarizing, voltage-gated K+ currents in adult mouse ventricles. J Physiol. 2004;559:103–120. - PMC - PubMed

Publication types

MeSH terms

LinkOut - more resources