. 2005 Aug 16;102(33):11787-92.
doi: 10.1073/pnas.0504905102. Epub 2005 Aug 4.

Identifying gene-independent noncoding functional elements in the yeast ribosomal DNA by phylogenetic footprinting

Affiliations

Identifying gene-independent noncoding functional elements in the yeast ribosomal DNA by phylogenetic footprinting

Austen R D Ganley et al. Proc Natl Acad Sci U S A. .

Abstract

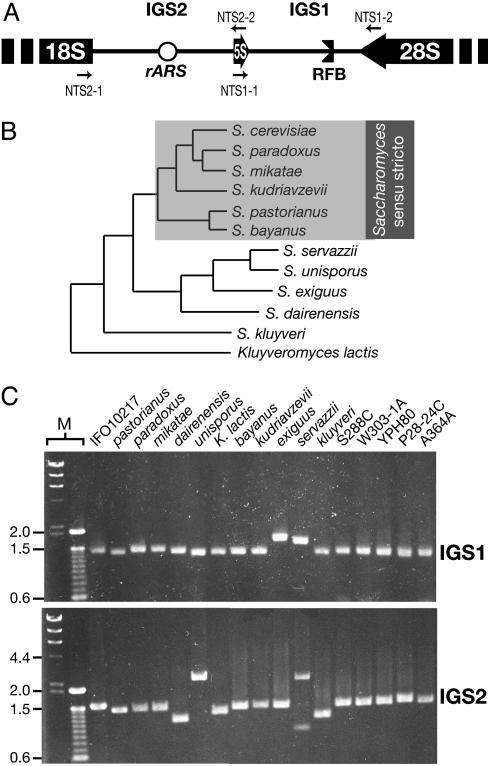
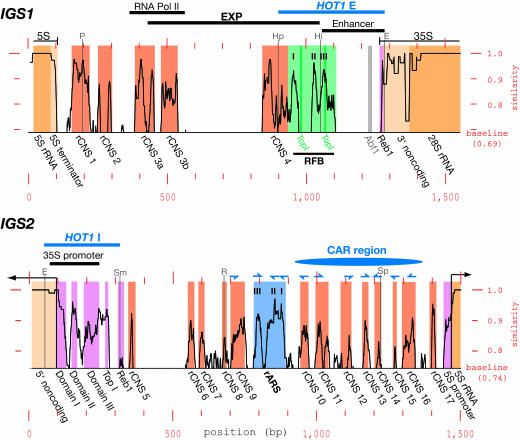
Sequences involved in the regulation of genetic and genomic processes are primarily located in noncoding regions. Identifying such cis-acting sequences from sequence data is difficult because their patterns are not readily apparent, and, to date, identification has concentrated on regions associated with gene-coding functions. Here, we used phylogenetic footprinting to look for gene-independent noncoding elements in the ribosomal RNA gene repeats from several Saccharomyces species. Similarity plots of ribosomal intergenic spacer alignments from six closely related Saccharomyces species allowed the identification of previously characterized functional elements, such as the origin-of-replication and replication-fork barrier sites, demonstrating that this method is a powerful predictor of noncoding functional elements. Seventeen previously uncharacterized elements, showing high levels of conservation, were also discovered. The conservation of these elements suggests that they are functional, and we demonstrate the functionality of two classes of these elements, a putative bidirectional noncoding promoter and a series of conserved peaks with matches to the origin-of-replication core consensus. Our results paint a comprehensive picture of the functionality of the Saccharomyces ribosomal intergenic region and demonstrate that functional elements not involved in gene-coding function can be identified by using comparative genomics based on sequence conservation.


Figures

Fig. 1.
Fig. 1.
Sequencing the IGS regions from various Saccharomyces yeasts. (A) The rDNA IGS of S. cerevisiae. 18S, 28S, and 5S rRNA genes are shown as blocks and the IGS regions as lines. The rARS and RFB sites are indicated. Large arrows indicate directions of transcription. Primers used to amplify the IGS for sequencing are shown (small arrows). The diagram is not drawn to scale. (B) Phylogenetic tree, showing the relationships of the Saccharomyces yeasts that were sequenced [adapted from Kurtzman and Robnett (12)]. Species from the Saccharomyces sensu stricto clade that were used for the subsequent analyses are boxed. Branch lengths are not drawn to scale. (C) Gel, showing the PCR-amplified IGS1 and IGS2 regions from all 17 isolates. Names are as in B, except that the various S. cerevisiae strains are shown as strain names. M, size markers (λ HindIII, and 100-bp ladders). Size marks are shown to the left (kb).
Fig. 2.
Fig. 2.
Similarity plots of IGS1 and IGS2. The level of similarity is given along the y axis by using sliding windows of 15 bp (IGS1, Top) or 20 bp (IGS2, Bottom) from the alignments of the 10 isolates (see Table 1). The “baseline” is the average level of similarity across the alignment for each region (actual values are also indicated). Elements of interest are boxed, with coding regions in yellow, transcribed regions upstream and downstream of the coding regions in pale yellow, rCNSs in orange, the RFB and rARS regions (each with three subelements indicated) in light green and blue, respectively, and other regions of interest in purple. The position of the nonconserved Abf1 site is shown in gray, and the positions of the two putative topoisomerase-I-binding sites (TopI) in the RFB are shown in dark green. Element names are given below the plots. Positions of other previously characterized, broad regions of interest are shown above the plots. Transcription-initiation and -termination sites are indicated by thin lines with arrowheads and block-ends, respectively. Conserved peaks matching the ARS consensus are marked with half arrowheads above the plots, and their strand locations and directions are indicated: alignment strand, upward-pointing half arrowhead; opposite strand, downward-pointing half arrowhead. Positions of familiar restriction enzyme sites are shown as thin gray lines (P, PvuII; Hp, HpaI; Hi, HindIII; E, EcoRI; Sm, SmaI; R, EcoRV; and Sp, SphI). The x axis is the position across each alignment.
Fig. 3.
Fig. 3.
Characterization of rCNSs in CAR. (A) Alignment of rCNSs that share similarity with the ACS. Sequences are from S. cerevisiae strain S288C, and the regions of similarity to the ACS are boxed. Nucleotides that match the ACS (shown above and below the alignments with accepted deviations) and that are conserved in all 10 isolates (Table 1) are black, those that match but are not completely conserved are blue, those that do not match but are completely conserved are green, and those that neither match nor are conserved are red. Flanking nucleotides are in lower case. The two alignments differ in their strand direction, as indicated by the arrows. rCNS names are shown to the right, along with the number of bases that match the ARS consensus. rv, the reverse complement of the alignment sequence was used. The three rARS ACSs are also included. (B) CHEF gel electrophoresis assaying rDNA amplification ability in the CAR replacement strain. The chromosome XII of two-copy rDNA strains with a replacement of CAR (ΔCAR) and the 5S rRNA gene (Δ5S) were resolved by CHEF electrophoresis. These strains were assayed after the introduction of FOB1 or an empty vector (+ and -, respectively). (Left) The ethidium bromide-strained gel. (Right) The gel probed with an rDNA probe, revealing chromosome XII (overlapping chromosomes VII and XV in the ΔCAR lanes of the left panel). A Hansenula wingei chromosome size marker (M; BioRad; missing from the Southern blot) and a parental two-rDNA-copy strain (C) were also included. Sizes of H. wingei chromosomes (Mb) and the positions of the other S. cerevisiae chromosomes are shown to the left.

References

    1. Mouse Genome Sequencing Consortium (2003) Nature 420, 520-562. - PubMed
    1. Pribnow, D. (1975) Proc. Natl. Acad. Sci. USA 72, 784-788. - PMC - PubMed
    1. Schaller, H., Gray, C. & Herrmann, K. (1975) Proc. Natl. Acad. Sci. USA 72, 737-741. - PMC - PubMed
    1. Tagle, D. A., Koop, B. F., Goodman, M., Slightom, J. L., Hess, D. L. & Jones, R. T. (1988) J. Mol. Biol. 203, 439-455. - PubMed
    1. Hardison, R. C. (2000) Trends Genet. 16, 369-372. - PubMed

Publication types

Associated data

LinkOut - more resources