. 2005 Jul-Aug;4(4):1060-72.
doi: 10.1021/pr050034b.

Correcting common errors in identifying cancer-specific serum peptide signatures

Affiliations

Correcting common errors in identifying cancer-specific serum peptide signatures

Josep Villanueva et al. J Proteome Res. 2005 Jul-Aug.

Abstract

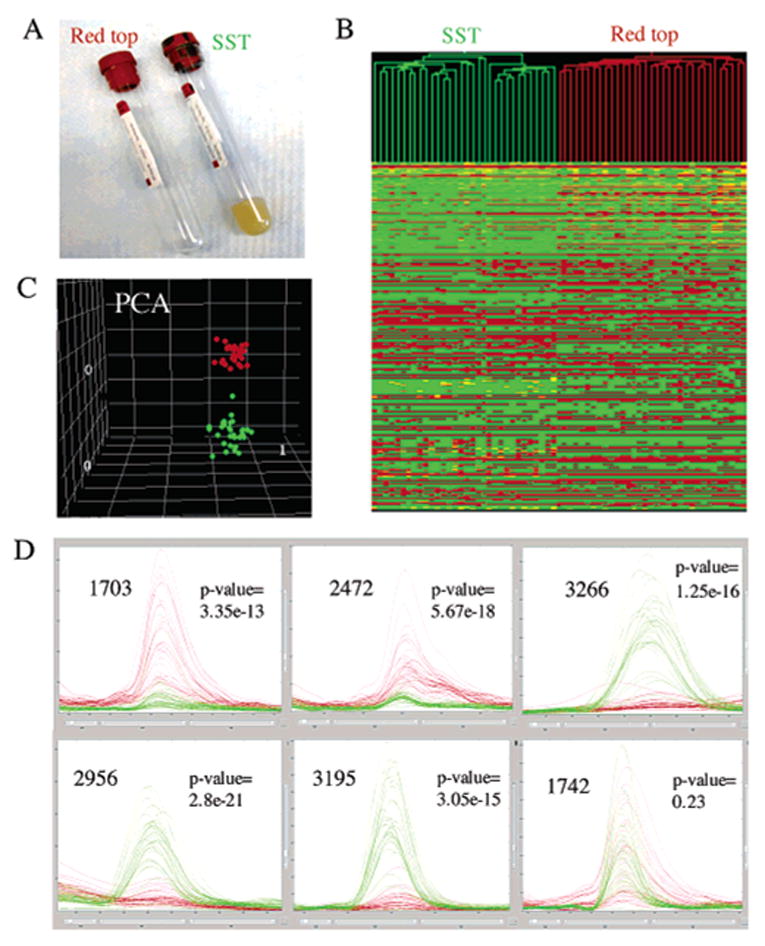
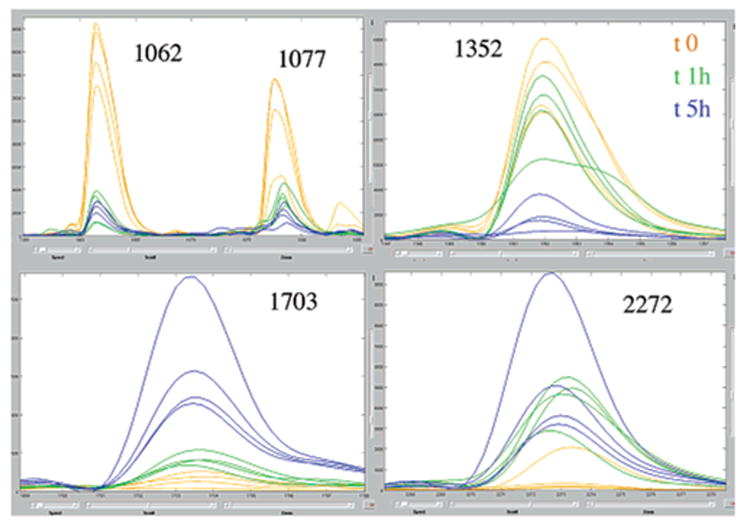
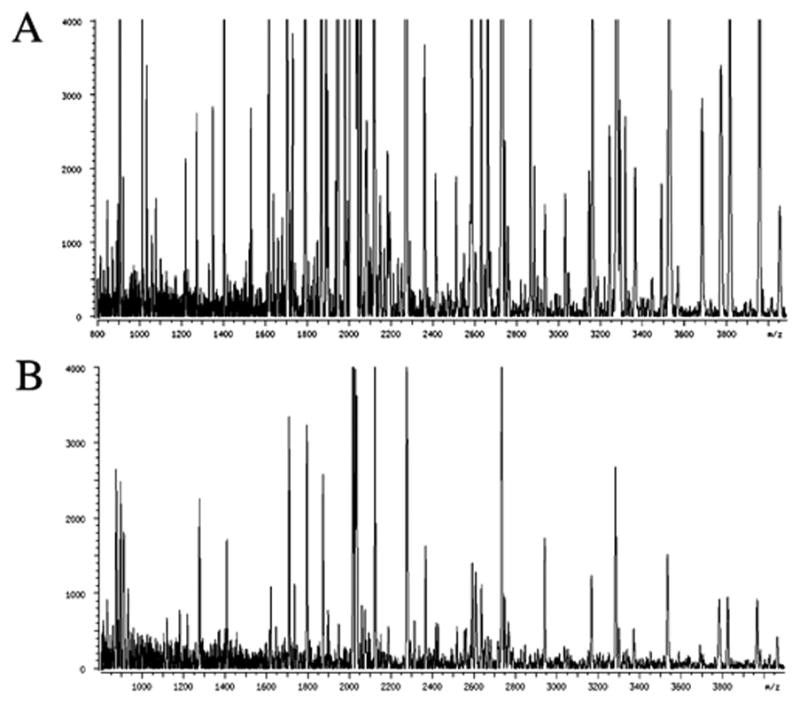
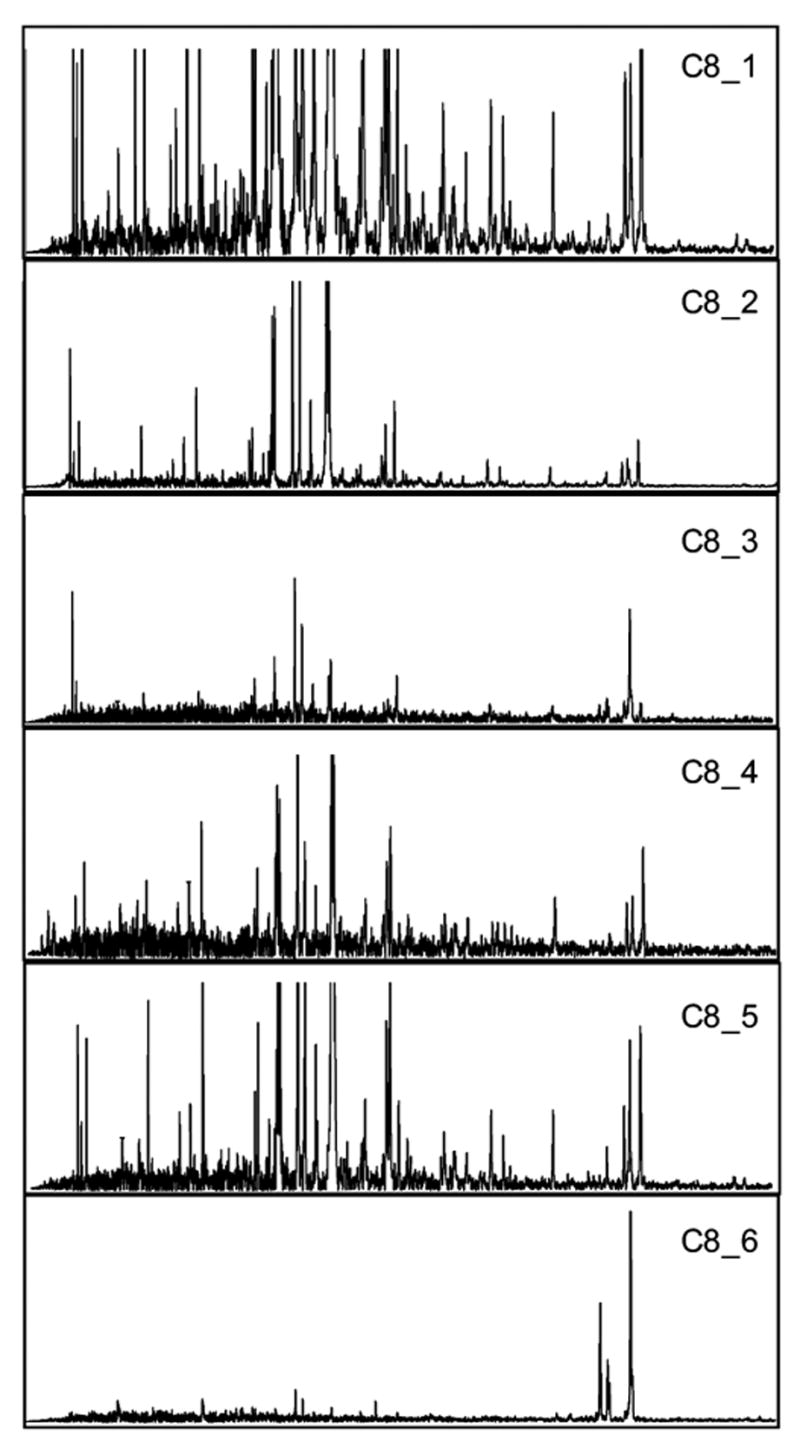
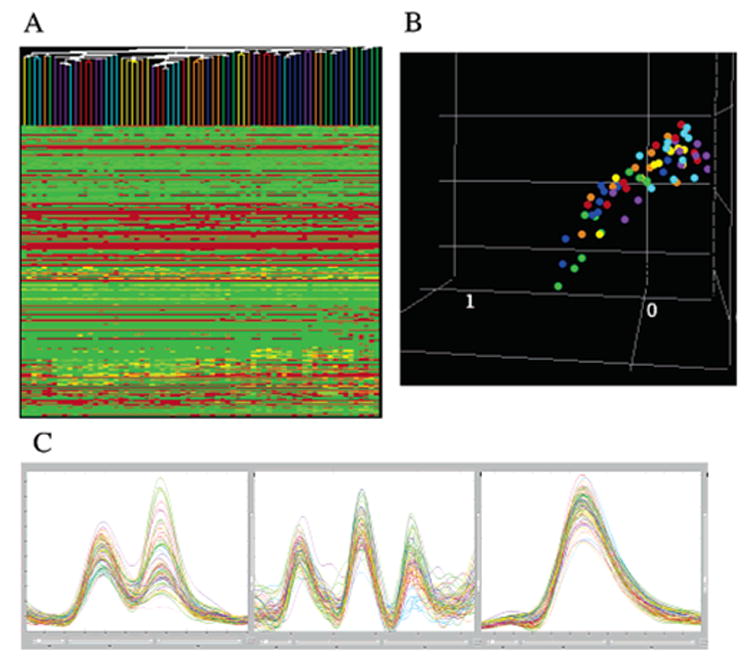
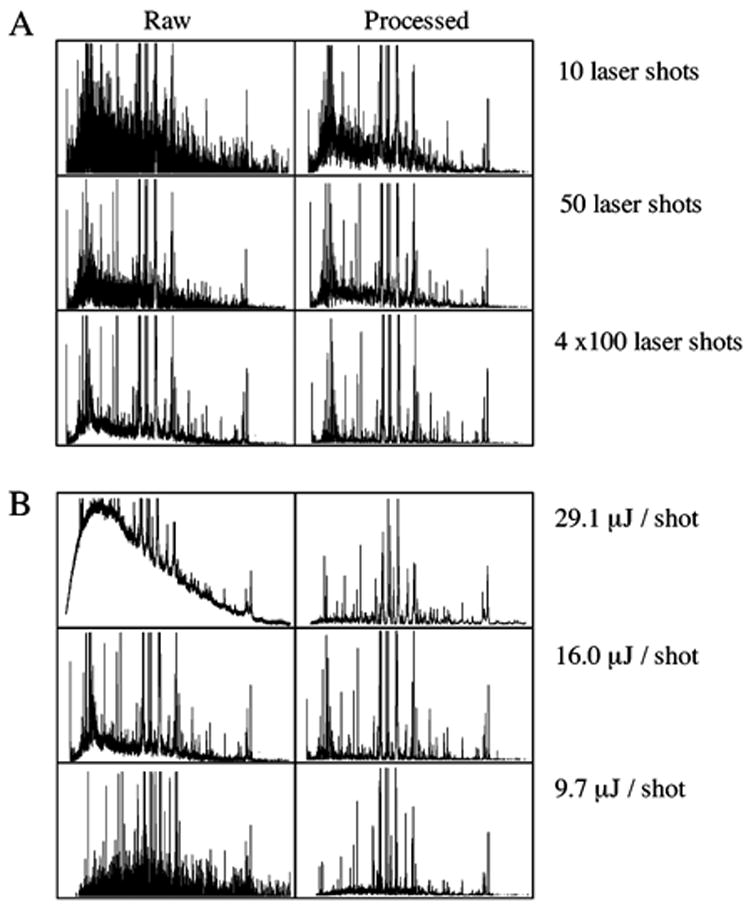
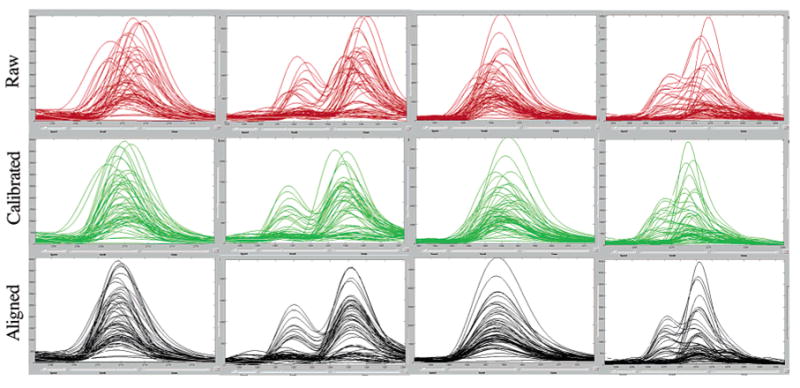
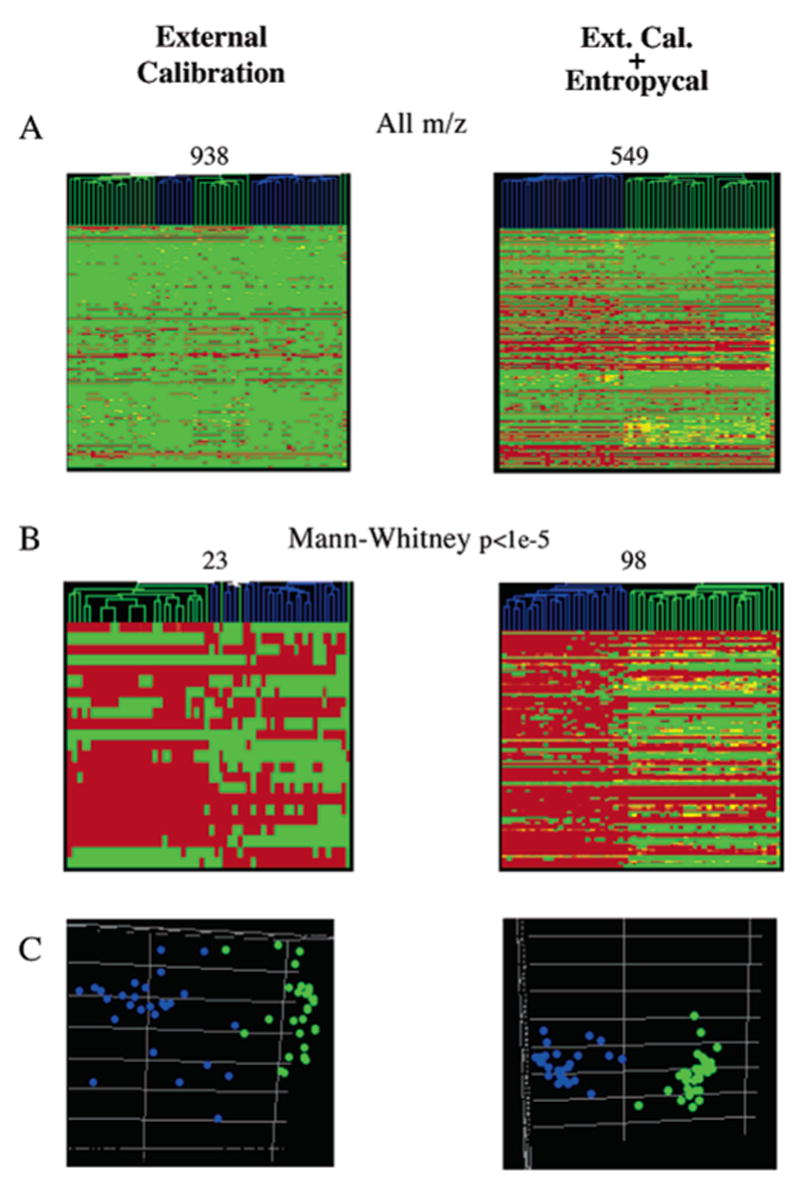
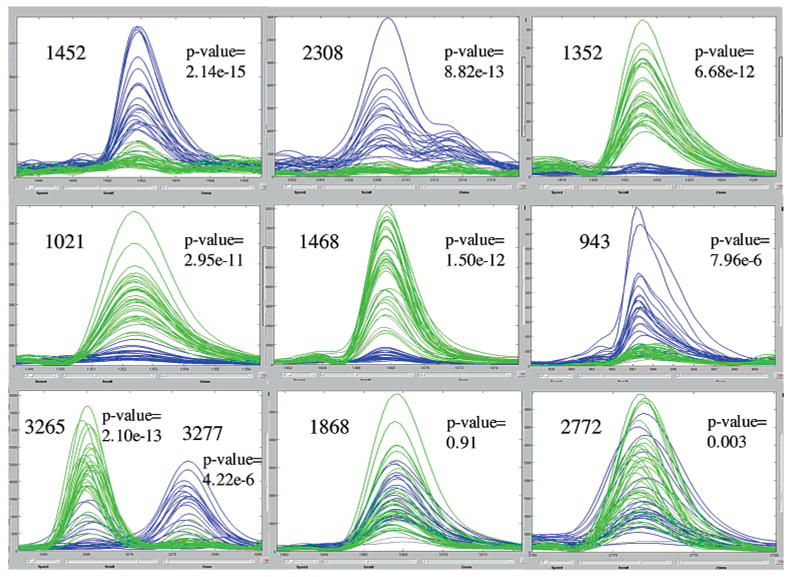
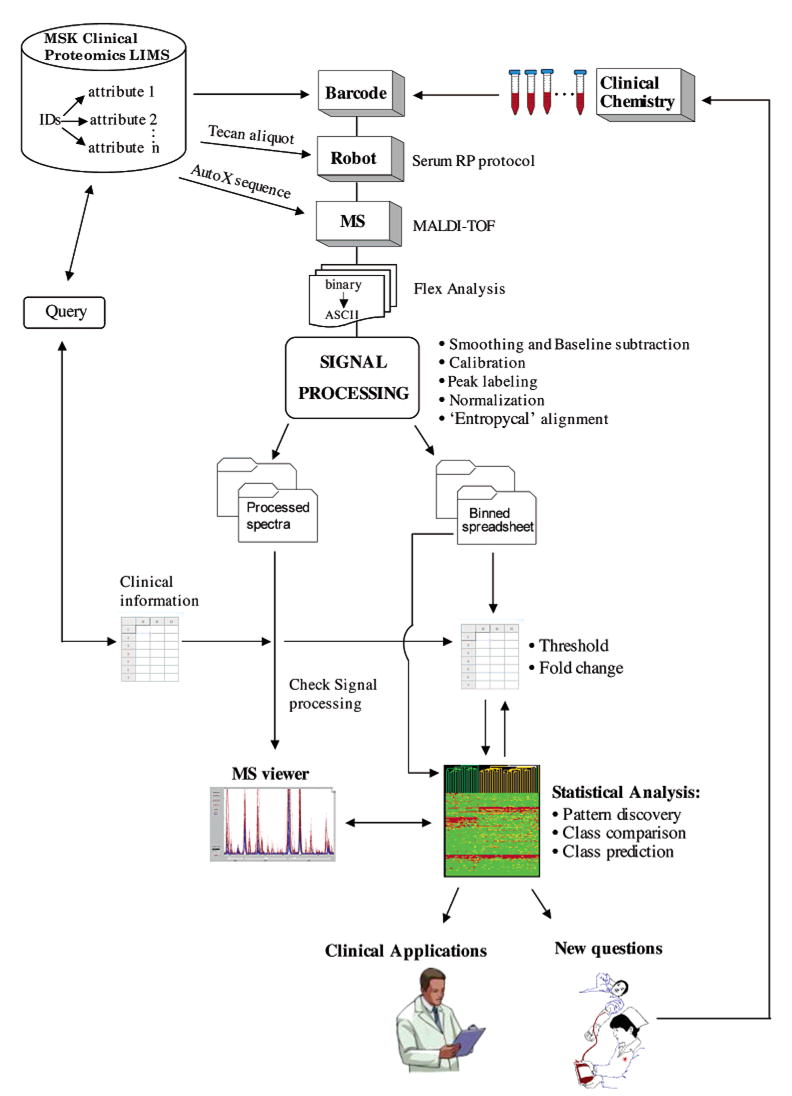
"Molecular signatures" are the qualitative and quantitative patterns of groups of biomolecules (e.g., mRNA, proteins, peptides, or metabolites) in a cell, tissue, biological fluid, or an entire organism. To apply this concept to biomarker discovery, the measurements should ideally be noninvasive and performed in a single read-out. We have therefore developed a peptidomics platform that couples magnetics-based, automated solid-phase extraction of small peptides with a high-resolution MALDI-TOF mass spectrometric readout (Villanueva, J.; Philip, J.; Entenberg, D.; Chaparro, C. A.; Tanwar, M. K.; Holland, E. C.; Tempst, P. Anal. Chem. 2004, 76, 1560-1570). Since hundreds of peptides can be detected in microliter volumes of serum, it allows to search for disease signatures, for instance in the presence of cancer. We have now evaluated, optimized, and standardized a number of clinical and analytical chemistry variables that are major sources of bias; ranging from blood collection and clotting, to serum storage and handling, automated peptide extraction, crystallization, spectral acquisition, and signal processing. In addition, proper alignment of spectra and user-friendly visualization tools are essential for meaningful, certifiable data mining. We introduce a minimal entropy algorithm, "Entropycal", that simplifies alignment and subsequent statistical analysis and increases the percentage of the highly distinguishing spectral information being retained after feature selection of the datasets. Using the improved analytical platform and tools, and a commercial statistics program, we found that sera from thyroid cancer patients can be distinguished from healthy controls based on an array of 98 discriminant peptides. With adequate technological and computational methods in place, and using rigorously standardized conditions, potential sources of patient related bias (e.g., gender, age, genetics, environmental, dietary, and other factors) may now be addressed.


Figures

Figure 1
Figure 1
Effect of the blood collection tube on MS-based serum peptide profiling. Blood from 32 healthy volunteers was collected in both red-top and SST tubes following the protocol described in Table 1. A. Red-top and SST tubes. B. Hierarchical clustering of 32 serum samples prepared in both red-top (red) and SST tubes (green). All 608 m/z peaks were used in the comparison. C. Principal Component Analysis (PCA) of the 2 × 32 samples. D. Overlay of mass spectra obtained from two groups of 32 samples. All spectra were processed as described in the methods section, and are displayed using Mass Spectra Viewer (MSV) (see Methods). The centroid of the bin and its Mann–Whitney adjusted p-value to separate the two groups (red-top vs SST) are shown for each peak.
Figure 2
Figure 2
Effect of clotting time on MS-based serum peptide profiling. Blood samples from 4 healthy volunteers were collected in 8.5-mL, BD Vacutainer SST tubes and allowed to clot at room temperature for 5 min (orange), 1 h (green) and 5 h (blue). The rest of the blood collection protocol was the same as in Table 1. All spectra were processed as described in the methods section, and are displayed using Mass Spectra Viewer (MSV) (see Methods). The centroid of the bin is shown for 5 representative m/z peaks.
Figure 3
Figure 3
Effect of freeze-thaw cycles on serum peptide profiling using RP magnetic particles and MALDI TOF MS. Frozen sera (at −80 °C) were thawed on wet ice, sampled and immediately placed at −80 °C for 30 min; this was repeated 4 times. Aliquots were taken after each freeze-thaw cycle and analyzed by the automated RP-protocol and MALDI-TOF MS. A. Mass spectrum from serum submitted to 2 freeze-thaw cycles. B. Mass spectrum from serum submitted to 4 freeze-thaw cycles.
Figure 4
Figure 4
Effect of different batches of C8/K magnetic particles on serum peptide profiling. Equal volumes of serum were incubated with fixed-weight amounts of different batches of SiMAG-C8/K RP beads (with variously modified properties) in separate experiments. Beads were washed, eluted with 50% acetonitrile in water, and the eluates analyzed, all as described under ‘Methods’. Segments of the MALDI-TOF mass spectra corresponding to peptides in the 0.7–4 kDa mass range (assuming z = 1) are shown.
Figure 5
Figure 5
Reproducibility of automated, solid-phase peptide extraction and MALDI-TOF MS. Seven runs consisting of 10 aliquots of the same serum sample randomized over a 96-position micro-tube holder were done using the TECAN liquid handler. Samples were independently processed and analyzed over seven consecutive weeks, using SiMAG-C8/K magnetic beads and the standard analytical protocol (see ‘Materials and methods’). A. Hierarchical clustering was done on the seven runs, whereby each run is represented with a different color. All 553 m/z peaks were used in the comparison. B. Principal Component Analysis (PCA) of the seven runs using all the m/z. Colors are the same used for hierarchical clustering. C. Overlay of mass spectra obtained from the seven runs done over seven consecutive weeks. All spectra were processed using the signal processing described in the methods section, and are displayed using Mass Spectra Viewer (MSV) (see Methods).
Figure 6
Figure 6
Effects of MALDI-TOF mass spectral acquisition variables on serum peptide profiling. Equal volumes of serum were incubated with fixed-weight amounts of magnetic SiMAG-C8/K beads, beads washed, eluted with 50% acetonitrile in water, and prepared for MALDI-TOF MS. Spectra were acquired in linear mode geometry. Segments of the MALDI-TOF mass spectra corresponding to peptides in the 0.7–4 kDa mass range (assuming z = 1) are shown. All the spectra derive from the same sample, at different locations in a single deposit on the target. All the spectra were processed using the signal processing described in the methods section. A. Three spectra were generated averaging different number of laser shots (indicated). The raw and processed spectra are displayed using Mass Spectra Viewer (MSV) (see Methods). B. Three spectra were generated using different effective laser energy (indicated) delivered to the target. Both the raw and processed spectra are displayed using Mass Spectra Viewer (MSV) (see Methods).
Figure 7
Figure 7
Effects of mass calibration and ‘Entropycal’-based alignment on mass spectra overlays. Fifty nine mass spectra obtained from serum samples of control individuals and thyroid carcinoma patients are shown in overlay. All spectra have been smoothed and baseline subtracted using the signal processing described in the methods section. Different mass calibrations were applied. Four regions of the spectra were selected and they are displayed using Mass Spectra Viewer (MSV) (see Methods). Each mass spectrum region is shown in a raw version (Raw), after external calibration (Calibrated) and after external calibration plus computer ‘Entropycal’ alignment (Aligned). External calibration and ‘Entropycal’-based alignment are described in the methods section.
Figure 8
Figure 8
Effect of mass calibration on statistical analysis. Spreadsheets containing binned peaklists for 59 mass spectra obtained from sera samples of 32 control individuals (green) and 27 thyroid carcinoma patients (blue) were imported into the Genespring program. Two spreadsheets contained a binned peaklist after smoothing, baseline subtraction and normalization described in the methods section. However, mass calibration and binning were different in the two sets: data with external calibration and binning at 1500 ppm (Calibrated) and data with external calibration and aligment using ‘entropycal’ (Aligned). A. Hierarchical clustering using all the bins was done on the two different signal-processing sets. B. Hierarchical clustering done using the m/z that passed the Mann–Whitney set at p < 1 × 10⁻⁵ for the two sets: Calibrated and Aligned. C. Principal Component Analysis (PCA) of the two sets using only the m/z that passed the Mann–Whitney test at p < 1 × 10⁻⁵.
Figure 9
Figure 9
Serum peptide signatures of thyroid tumor patients. Overlay of mass spectra obtained from serum samples of 32 control individuals (green) and 27 thyroid carcinoma patients (blue). All spectra were processed using the signal processing described in the methods section. Some m/z with either very small or large p-values, calculated using the Mann–Whitney test, were selected and are displayed using Mass Spectra Viewer (MSV). The centroid of the peak and its Mann–Whitney p-value to separate the two groups (controls and thyroid carcinoma) are shown for each peak.
Figure 10
Figure 10
MSKCC serum peptidomics operation. Flowchart showing the various steps of the serum peptidomics approach described in this report.

References

    1. Petricoin EF, Ardekani AM, Hitt BA, Levine PJ, Fusaro VA, Steinberg SM, Mills GB, Simone C, Fishman DA, Kohn EC, Liotta LA. Lancet. 2002;359(9306):572–577. - PubMed
    1. Adam BL, Qu Y, Davis JW, Ward MD, Clements MA, Cazares LH, Semmes OJ, Schellhammer PF, Yasui Y, Feng Z, Wright GL., Jr Cancer Res. 2002;62(13):3609–3614. - PubMed
    1. Li J, Zhang Z, Rosenzweig J, Wang YY, Chan DW. Clin Chem. 2002;48(8):1296–1304. - PubMed
    1. Borozdenkova S, Westbrook JA, Patel V, Wait R, Bolad I, Burke MM, Bell AD, Banner NR, Dunn MJ, Rose ML. J Proteome Res. 2004;3(2):282–288. - PubMed
    1. Ebert MP, Meuer J, Wiemer JC, Schulz HU, Reymond MA, Traugott U, Malfertheiner P, Rocken C. J Proteome Res. 2004;3(6):1261–1266. - PubMed

Publication types