

doi: 10.1016/j.str.2005.06.005.
The pore structure of the closed RyR1 channel
Affiliations
- PMID: 16084392
- PMCID: PMC2983469
- DOI: 10.1016/j.str.2005.06.005
Item in Clipboard
The pore structure of the closed RyR1 channel
Structure.
2005 Aug.
Abstract
Using single particle electron cryomicroscopy, several helices in the membrane-spanning region of RyR1, including an inner transmembrane helix, a short pore helix, and a helix parallel to the membrane on the cytoplasmic side, have been clearly resolved. Our model places a highly conserved glycine (G4934) at the hinge position of the bent inner helix and two rings of negative charges at the luminal and cytoplasmic mouths of the pore. The kinked inner helix closely resembles the inner helix of the open MthK channel, suggesting that kinking alone does not open RyR1, as proposed for K+ channels.
Figures
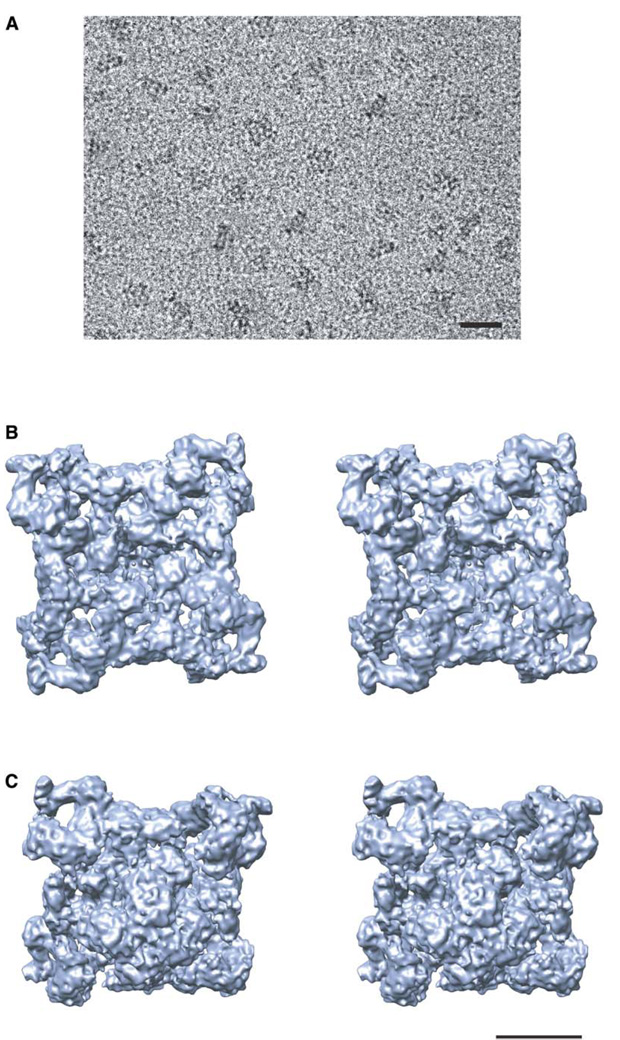
(A) 200 kV electron image of RyR1 embedded in ice recorded at 60,000× magnification with a Gatan 4k × 4k CCD camera on a JEM2010F electron cryomicroscope. (B and C) Stereoview of the 9.6 Å resolution density map of RyR1 viewed from (B) the cytoplasmic side along the 4-fold axis and (C) the lumenal side in an oblique orientation. The bar denotes 500 Å scale in (A) and 100 Å scale in (B) and (C).
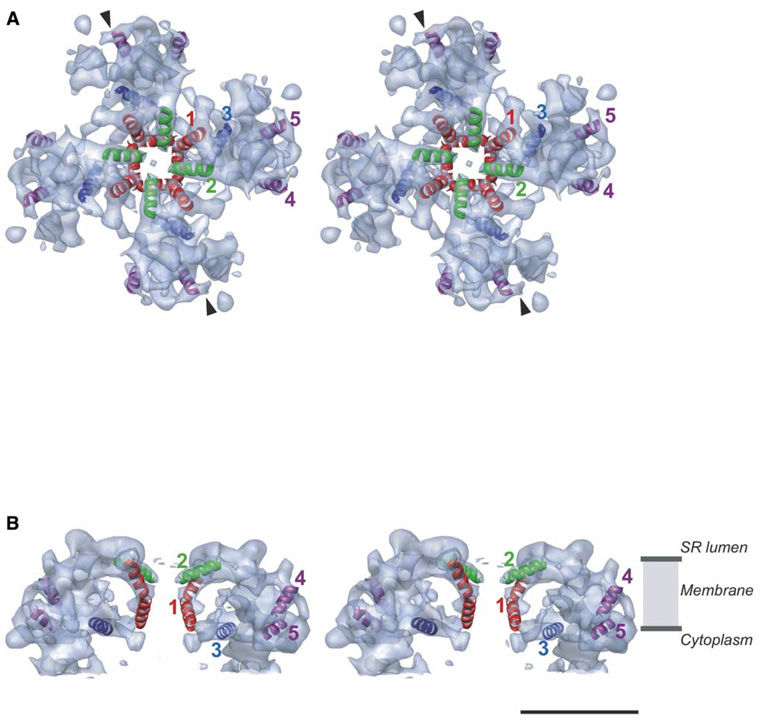
(A) Stereoview of the membrane-spanning region viewed from the SR luminal side along the 4-fold axis. The densities attributable to α helices are annotated as color ribbons: red, the inner helix; green, the pore helix; blue and purple, the other helices. Arrows denote the direction of the slice shown in Figure 4A. (B) Side view (view normal to the 4-fold axis) of two of the four subunits of RyR1 with annotated helices showing the relative positions of putative α helices within the SR membrane. A high contour level is used in (A) and (B) to emphasize the strongest densities interpreted as α helices. The bar denotes 50 Å scale.

(A) Side view of the membrane-spanning region displayed at the threshold level corresponding to a molecular mass of 2.2 MDa. The levels of sections are indicated with red dashed lines and are numbered beginning from the luminal side. (B) Sections of density map normal to the 4-fold channel axis at the levels indicated in (A). The threshold for continuous contour lines and color coding has been chosen to highlight the density peaks composing the membrane-spanning region. The positions of the five rod-like densities in the four selected sections in the membrane-spanning region are indicated with corresponding numbers. The bar denotes 50 Å scale.
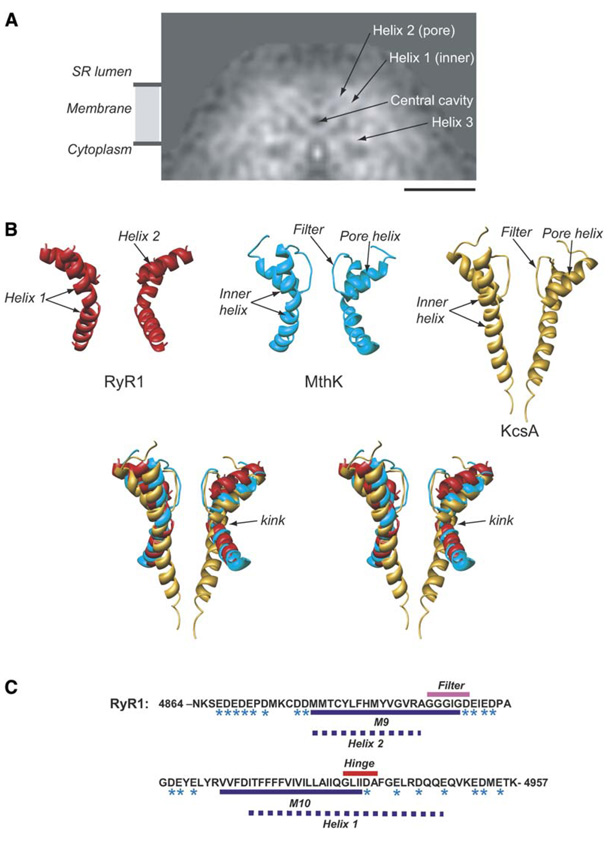
(A) A slice of density through RyR1 parallel to the 4-fold axis in the direction indicated by the arrows in (Figure 2A). (B) Relative arrangement of pore and inner helices from two opposing subunits of the cryoEM map of RyR1 (red). X-ray structures of the MthK channel, 1LNQ (cyan), and of the KcsA channel, 1BL8 (gold), are shown. Two subunits of the RyR1, MthK, and KcsA pore-forming regions are superimposed and are oriented with the cytoplasmic side facing down. (C) Sequence of the putative pore-forming region of RyR1 (GI: 134134). Residues with negative charges are marked with an asterisk. The dashed lines denote our prediction for the pore-forming helices of RyR1: residues M4879–A4893 correspond to the inner, pore-lining helix (helix 1); residues I4918– E4948 correspond to the P helix (helix 2). The bar in (A) denotes 50 Å scale.

Brighter dots denote a larger number of particles. This shows a fairly uniform distribution of particle orientations.
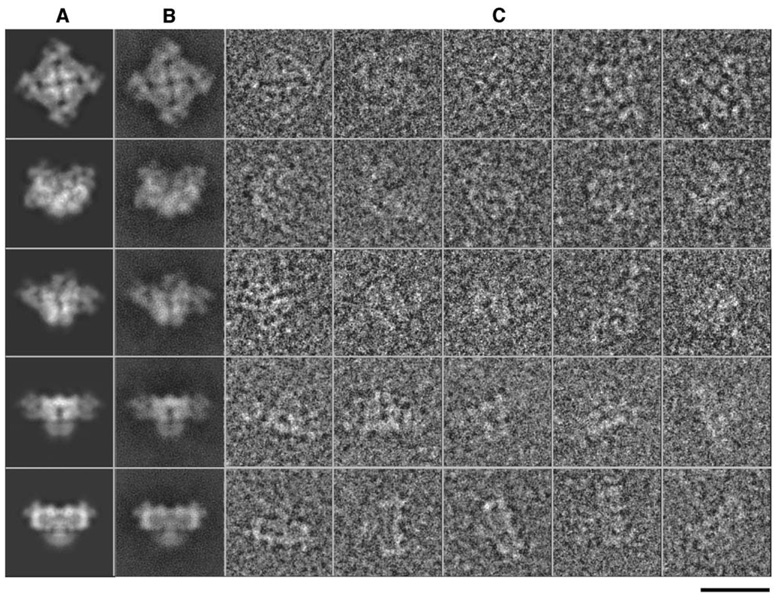
(A–C) (A) Selected reprojections of the final 3D structure, (B) corresponding class averages, and (C) raw particle images. Their apparent match is a key indication of the self-consistency of the reconstruction. The bar denotes 250 Å scale.

A threshold of 0.5 is used to assess the resolution of the reconstruction, which is 9.6 Å.
Comment in
-
Bend to open?Structure. 2005 Aug;13(8):1094-5. doi: 10.1016/j.str.2005.07.004. Structure. 2005. PMID: 16084381 No abstract available.
References
-
- Baker ML, Jiang W, Chiu W. Analysis of intermediate resolution structures. Biophys. J. 2005;88:23.
-
- Booth CR, Jiang W, Baker ML, Hong Zhou Z, Ludtke SJ, Chiu W. A 9 Å single particle reconstruction from CCD coucaptured images on a 200 kV electron cryomicroscope. J. Struct. Biol. 2004;147:116–127. - PubMed
-
- Böttcher B, Wynne SA, Crowther RA. Determination of the fold of the core protein of hepatitis B virus by electron cryomicroscopy. Nature. 1997;386:88–91. - PubMed
-
- Callaway C, Seryshev A, Wang JP, Slavik KJ, Needleman DH, Cantu C, 3rd, Wu Y, Jayaraman T, Marks AR, Hamilton SL. Localization of the high and low affinity [3H]ryanodine binding sites on the skeletal muscle Ca2+ release channel. J. Biol. Chem. 1994;269:15876–15884. - PubMed
-
- Chang G, Spencer RH, Lee AT, Barclay MT, Rees DC. Structure of the MscL homolog from Mycobacterium tuberculosis: a gated mechanosensitive ion channel. Science. 1998;282:2220–2226. - PubMed
Publication types
MeSH terms
Substances
Grants and funding
LinkOut - more resources
Full Text Sources
Other Literature Sources
Molecular Biology Databases
