

Using progenitor strain information to identify quantitative trait nucleotides in outbred mice
- PMID: 16085706
- PMCID: PMC1456780
- DOI: 10.1534/genetics.104.028902
Using progenitor strain information to identify quantitative trait nucleotides in outbred mice
Abstract
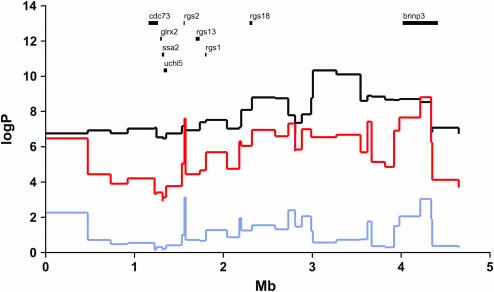
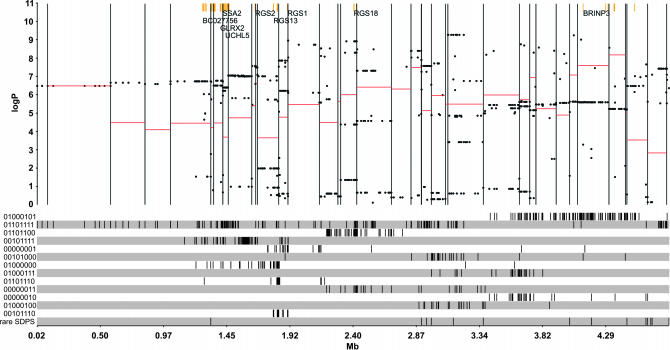
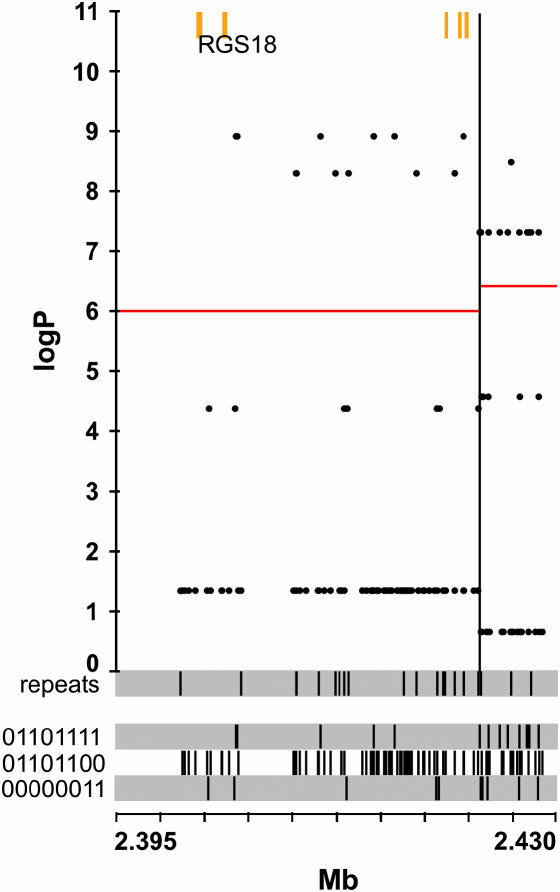
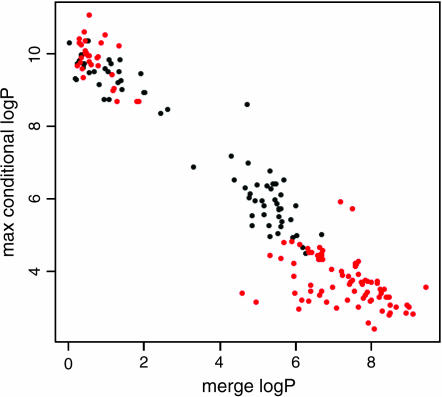
We have developed a fast and economical strategy for dissecting the genetic architecture of quantitative trait loci at a molecular level. The method uses two pieces of information: mapping data from crosses that involve more than two inbred strains and sequence variants in the progenitor strains within the interval containing a quantitative trait locus (QTL). By testing whether the strain distribution pattern in the progenitor strains is consistent with the observed genetic effect of the QTL we can assign a probability that any sequence variant is a quantitative trait nucleotide (QTN). It is not necessary to genotype the animals except at a skeleton of markers; the genotypes at all other polymorphisms are estimated by a multipoint analysis. We apply the method to a 4.8-Mb region on mouse chromosome 1 that contains a QTL influencing anxiety segregating in a heterogeneous stock and show that, under the assumption that a single QTN is present and lies in a region conserved between the human and mouse genomes, it is possible to reduce the number of variants likely to be the quantitative trait nucleotide from many thousands to <20.
Figures
Similar articles
-
Mouse inbred strain sequence information and yin-yang crosses for quantitative trait locus fine mapping.Genetics. 2005 Feb;169(2):849-54. doi: 10.1534/genetics.104.032474. Epub 2004 Nov 1. Genetics. 2005. PMID: 15520253 Free PMC article.
-
Quantitative trait locus mapping of acute functional tolerance in the LXS recombinant inbred strains.Alcohol Clin Exp Res. 2015 Apr;39(4):611-20. doi: 10.1111/acer.12678. Alcohol Clin Exp Res. 2015. PMID: 25833023 Free PMC article.
-
Invited review: quantitative trait nucleotide determination in the era of genomic selection.J Dairy Sci. 2011 Mar;94(3):1082-90. doi: 10.3168/jds.2010-3793. J Dairy Sci. 2011. PMID: 21338774 Review.
-
Using whole-genome sequences of the LG/J and SM/J inbred mouse strains to prioritize quantitative trait genes and nucleotides.BMC Genomics. 2015 May 28;16(1):415. doi: 10.1186/s12864-015-1592-3. BMC Genomics. 2015. PMID: 26016481 Free PMC article.
-
QTL mapping using high-throughput sequencing.Methods Mol Biol. 2015;1284:257-85. doi: 10.1007/978-1-4939-2444-8_13. Methods Mol Biol. 2015. PMID: 25757777 Review.
Cited by
-
Genetic analysis of hematological parameters in incipient lines of the collaborative cross.G3 (Bethesda). 2012 Feb;2(2):157-65. doi: 10.1534/g3.111.001776. Epub 2012 Feb 1. G3 (Bethesda). 2012. PMID: 22384394 Free PMC article.
-
Multiparent intercross populations in analysis of quantitative traits.J Genet. 2012;91(1):111-7. doi: 10.1007/s12041-012-0144-8. J Genet. 2012. PMID: 22546834 Review.
-
The polymorphism architecture of mouse genetic resources elucidated using genome-wide resequencing data: implications for QTL discovery and systems genetics.Mamm Genome. 2007 Jul;18(6-7):473-81. doi: 10.1007/s00335-007-9045-1. Epub 2007 Aug 3. Mamm Genome. 2007. PMID: 17674098 Free PMC article.
-
Identifying genetic susceptibility to Aspergillus fumigatus infection using collaborative cross mice and RNA-Seq approach.Animal Model Exp Med. 2024 Feb;7(1):36-47. doi: 10.1002/ame2.12386. Epub 2024 Feb 14. Animal Model Exp Med. 2024. PMID: 38356021 Free PMC article.
-
Multi-parent populations in crops: a toolbox integrating genomics and genetic mapping with breeding.Heredity (Edinb). 2020 Dec;125(6):396-416. doi: 10.1038/s41437-020-0336-6. Epub 2020 Jul 3. Heredity (Edinb). 2020. PMID: 32616877 Free PMC article. Review.
References
-
- Albanese, V., N. F. Biguet, H. Kiefer, E. Bayard, J. Mallet et al., 2001. Quantitative effects on gene silencing by allelic variation at a tetranucleotide microsatellite. Hum. Mol. Genet. 10: 1785–1792. - PubMed
-
- Allen, M., A. Heinzmann, E. Noguchi, G. Abecasis, J. Broxholme et al., 2003. Positional cloning of a novel gene influencing asthma from chromosome 2q14. Nat. Genet. 35: 258–263. - PubMed
-
- Anholt, R. R., C. L. Dilda, S. Chang, J. J. Fanara, N. H. Kulkarni et al., 2003. The genetic architecture of odor-guided behavior in Drosophila: epistasis and the transcriptome. Nat. Genet. 35: 180–184. - PubMed
-
- Beck, J. A., S. Lloyd, M. Hafezparast, M. Lennon-Pierce, J. T. Eppig et al., 2000. Genealogies of mouse inbred strains. Nat. Genet. 24: 23–25. - PubMed
Publication types
MeSH terms
Substances
Grants and funding
LinkOut - more resources
Full Text Sources
Molecular Biology Databases
Miscellaneous
