. 2005 Oct;89(4):2759-69.
doi: 10.1529/biophysj.105.066738. Epub 2005 Aug 5.

Variable incidence angle fluorescence interference contrast microscopy for z-imaging single objects

Affiliations

Variable incidence angle fluorescence interference contrast microscopy for z-imaging single objects

Caroline M Ajo-Franklin et al. Biophys J. 2005 Oct.

Abstract

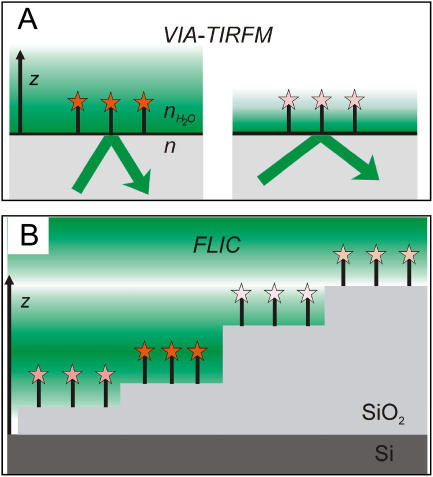
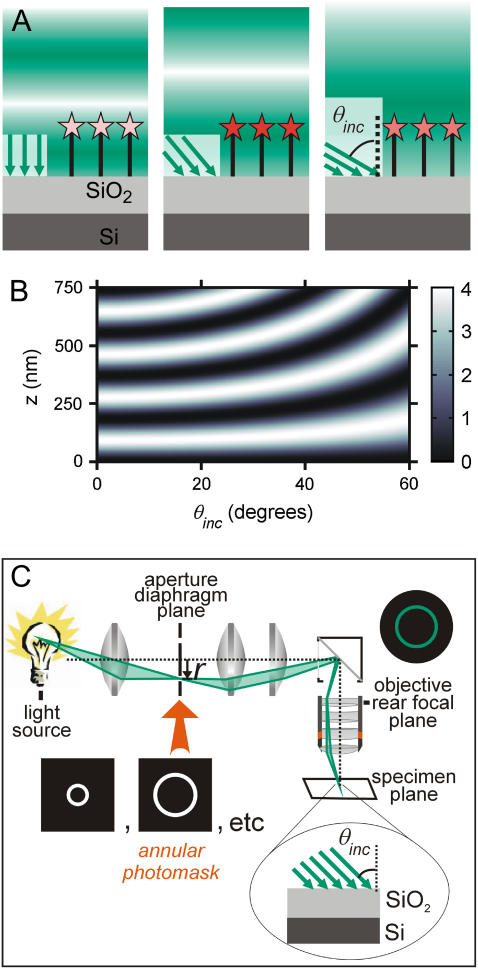
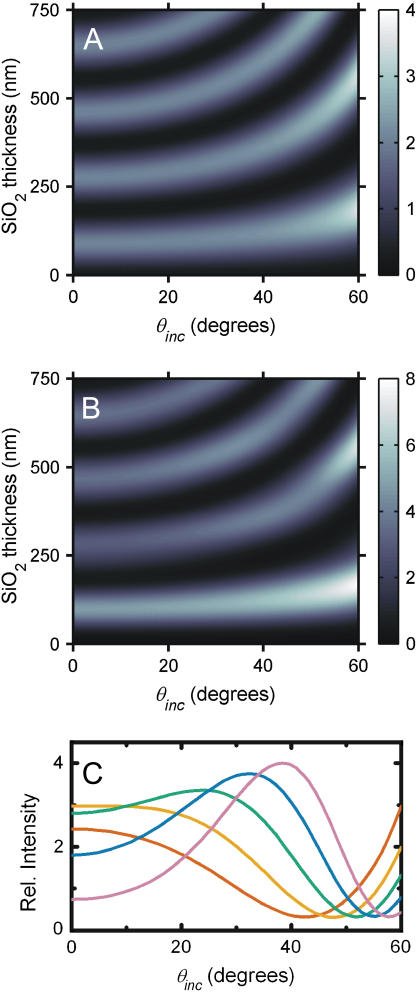
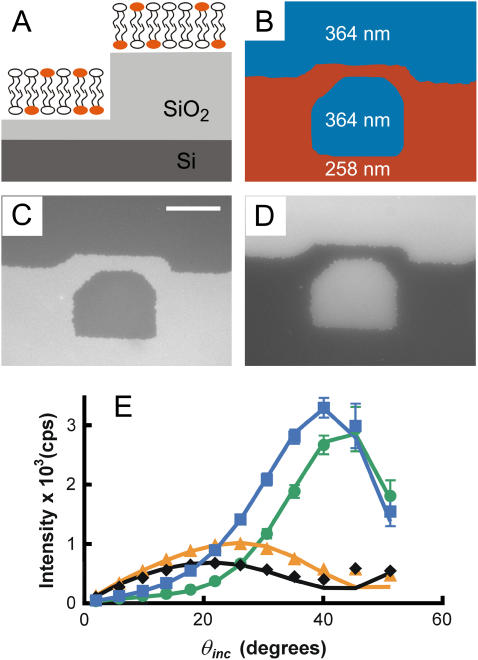
Surface-generated structured illumination microscopies interrogate the position of fluorescently labeled objects near surfaces with nanometer resolution along the z axis. However, these techniques are either experimentally cumbersome or applicable to a limited set of experimental systems. We present a new type of surface-generated structured illumination fluorescence microscopy, variable incidence angle fluorescence interference contrast microscopy (VIA-FLIC), in which the fluorescent sample is assembled above a reflective Si surface and the incidence angle of excitation light is varied by placing annular photomasks with different radii in the aperture diaphragm plane of the microscope. The variation in incidence angle alters the interference pattern of excitation light, and hence the intensity of detected fluorescence. Quantitative VIA-FLIC is tested by using a set of fluorophore-containing supported membranes separated from the Si surface by SiO2 layers of variable thicknesses. The resulting fluorescence intensity versus incidence angle curves depends on the separation from the Si surface and when fit with an appropriate model yield precise SiO2 thicknesses that are accurate with respect to the known SiO2 thicknesses. Since only a simple modification to a standard epifluorescence microscope is required, VIA-FLIC offers a versatile method to produce z-reconstructions with high resolution for a wide range of biological systems.


Figures

FIGURE 1
FIGURE 1
(A) Schematic of VIA-TIRFM. In VIA-TIRFM, the characteristic 1/e distance of the exponentially decaying evanescent is modulated by varying the incidence angle at the TIR interface. (B) Schematic of FLIC. In FLIC, an interference pattern is created by reflection from the Si surface. By assembling the object of interest on many different SiO2 steps, its position relative to the nodes and antinodes of the interference pattern is modulated. In these schematic diagrams, high intensity excitation light is denoted by a dark green background, shading to low excitation intensity in white.
FIGURE 2
FIGURE 2
(A) Schematic of VIA-FLIC. The angle between incoming rays and the normal to the mirror surface is the incidence angle, θinc. Modulation of θinc varies the period of the interference pattern. Intensity of excitation light as a function of z is denoted by shading (dark green for high intensity, white for low intensity) as in Fig. 1. (B) A surface plot of the light intensity near a mirror as a function of z and θinc, calculated using Eq. 3 and λ = 370 nm. The relative intensity at any abscissa and ordinate is given by the color bar on the right. (C) Schematic of VIA-FLIC apparatus. In an epifluorescence microscope, an annular photomask replaces the aperture diaphragm. Since each radial position in the aperture diaphragm plane, r, corresponds to a particular θinc (Eq. 2), a hollow cone of excitation light comprising a narrow range of θinc values is focused at the specimen plane. The fluorescently labeled sample is assembled on an SiO2/Si substrate, and the emitted fluorescence is collected with the full NA of the objective.
FIGURE 3
FIGURE 3
(A and B) Surface plots of the calculated relative power as a function of θinc and SiO2 thickness for fluorophores located in the center of a supported bilayer. The relative intensity at any abscissa and ordinate is given by the color bar to the right of each plot. The absorption transition dipole moment and the emission transition dipole moment are both 90° relative to the surface normal. (A) Calculation of relative absorbed power, formula image for bandpass excitation at 546 nm with a width of 50 nm. (B) Calculation of relative detected fluorescence power, formula image assuming 546 nm bandpass excitation as in A, and bandpass detection at 588 nm with a width of 50 nm and NA = 1.30. (C) The relative detected fluorescence power as calculated in B for several SiO2 thicknesses, 250 nm (red line), 275 nm (orange line), 300 nm (green line), 325 nm (blue line), and 350 nm (purple line).
FIGURE 4
FIGURE 4
VIA-FLIC of DiI-containing supported membranes located at different distances from the Si mirror surface. (A and B) Schematic illustration of the experiment. DiI-containing supported membranes are formed on different SiO2 steps of different thicknesses, creating objects with the same density of fluorophores positioned at different distances in z from the Si surface. There are 364 nm and 258 nm of SiO2 on Si on the top and bottom steps, respectively. The puzzle piece-shaped border between the SiO2 steps is a result of the transparency photomask used to create the SiO2/Si surface (see Materials and Methods). (C and D) VIA-FLIC images of two supported membranes that contain 1 mol % DiI separated by different distances from the Si by two different SiO2 thicknesses. (C) Illumination with θinc centered around 9.8°. (D) The same position with θinc centered around 35.2°. (E) Intensity of 1% DiI-supported membranes located at different positions in z on a SiO2/Si surface as a function of θinc. The symbols and lines are intensity measurements for different SiO2 thicknesses and calculated best fits using Eq. 9, respectively: 255 nm (black diamonds, fit 254 nm, black line), 276 nm (orange triangles, fit 280 nm, orange line), 364 nm (blue squares, fit 358 nm, blue line), and 385 nm (green circles, fit 380 nm, green line).

References

    1. Zhang, J., R. E. Campbell, A. Y. Ting, and R. Y. Tsien. 2002. Creating new fluorescent probes for cell biology. Nat. Rev. Mol. Cell Biol. 3:906–918. - PubMed
    1. Hell, S. W. 2003. Toward fluorescence nanoscopy. Nat. Biotechnol. 21:1347–1355. - PubMed
    1. Dyba, M., S. Jakobs, and S. W. Hell. 2003. Immunofluorescence stimulated emission depletion microscopy. Nat. Biotechnol. 21:1303–1304. - PubMed
    1. Rohrbach, A. 2000. Observing secretory granules with a multiangle evanescent wave microscope. Biophys. J. 78:2641–2654. - PMC - PubMed
    1. Stock, K., R. Sailer, W. S. L. Strauss, M. Lyttek, R. Steiner, and H. Schneckenburger. 2003. Variable-angle total internal reflection fluorescence microscopy (VA-TIRFM): realization and application of a compact illumination device. J. Microsc. 211:19–29. - PubMed

Publication types

MeSH terms

LinkOut - more resources