. 2005 Aug;71(8):4679-89.
doi: 10.1128/AEM.71.8.4679-4689.2005.

Genetic diversity of viable, injured, and dead fecal bacteria assessed by fluorescence-activated cell sorting and 16S rRNA gene analysis

Affiliations

Genetic diversity of viable, injured, and dead fecal bacteria assessed by fluorescence-activated cell sorting and 16S rRNA gene analysis

Kaouther Ben-Amor et al. Appl Environ Microbiol. 2005 Aug.

Abstract

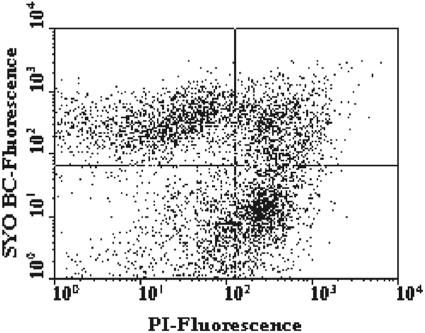
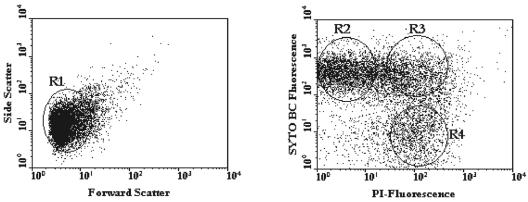
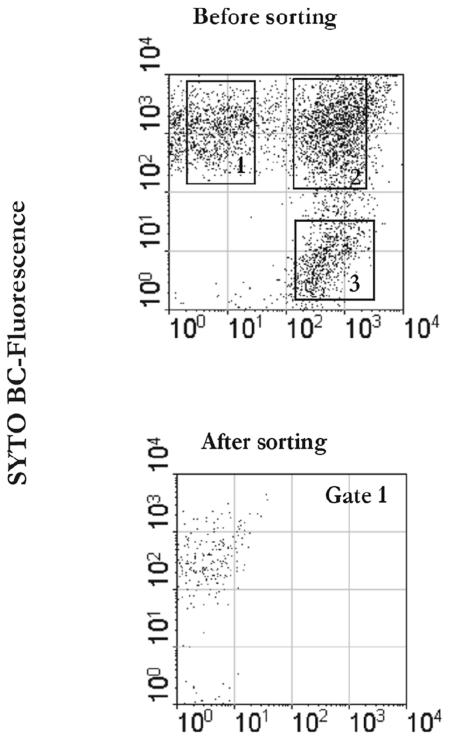
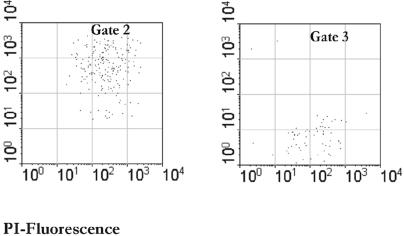
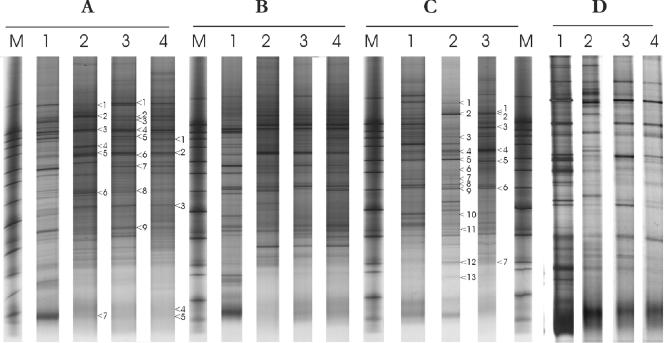
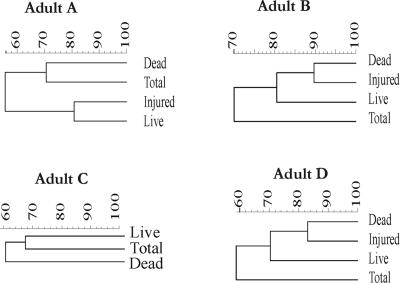
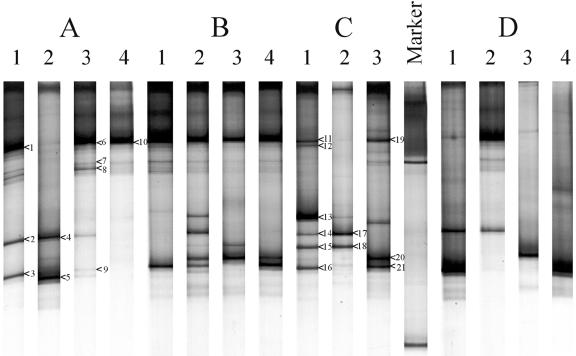
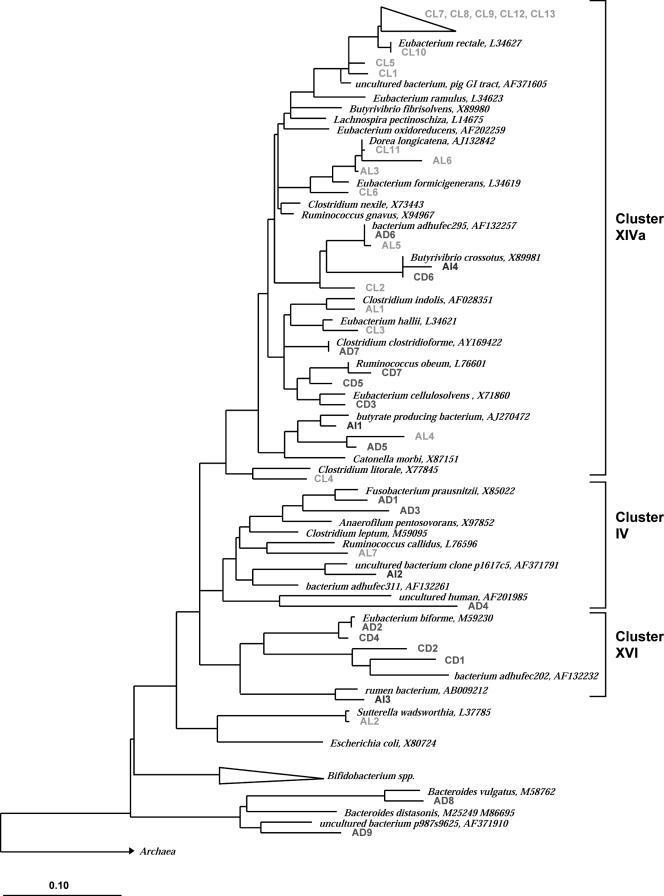
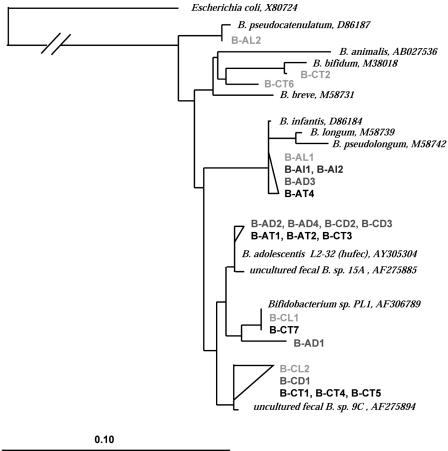
A novel approach combining a flow cytometric in situ viability assay with 16S rRNA gene analysis was used to study the relationship between diversity and activity of the fecal microbiota. Simultaneous staining with propidium iodide (PI) and SYTO BC provided clear discrimination between intact cells (49%), injured or damaged cells (19%), and dead cells (32%). The three subpopulations were sorted and characterized by denaturing gradient gel electrophoresis (DGGE) of 16S rRNA gene amplicons obtained from the total and bifidobacterial communities. This analysis revealed that not only the total community but also the distinct subpopulations are characteristic for each individual. Cloning and sequencing of the dominant bands of the DGGE patterns showed that most of clones retrieved from the live, injured, and dead fractions belonged to Clostridium coccoides, Clostridium leptum, and Bacteroides. We found that some of the butyrate-producing related bacteria, such as Eubacterium rectale and Eubacterium hallii, were obviously viable at the time of sampling. However, amplicons affiliated with Bacteroides and Ruminococcus obeum- and Eubacterium biforme-like bacteria, as well as Butyrivibrio crossotus, were obtained especially from the dead population. Furthermore, some bacterial clones were recovered from all sorted fractions, and this was especially noticeable for the Clostridium leptum cluster. The bifidobacterial phylotypes identified in total samples and sorted fractions were assigned to Bifidobacterium adolescentis, Bifidobacterium longum, Bifidobacterium infantis, Bifidobacterium pseudocatenulatum, and Bifidobacterium bifidum. Phylogenetic analysis of the live, dead, and injured cells revealed a remarkable physiological heterogeneity within these bacterial populations; B. longum and B. infantis were retrieved from all sorted fractions, while B. adolescentis was recovered mostly from the sorted dead fraction.


Figures

FIG. 1.
FIG. 1.
FCM analysis of a fecal sample stained with SYTO BC and PI. The two-color dot plot discriminated between SYTO BC-stained viable cells (upper left quadrant), double-stained injured cells (upper right quadrant), PI-stained dead cells (lower right quadrant), and STYO BC- and PI-stained injured cells. Results were obtained with the FACSCalibur.
FIG. 2.
FIG. 2.
FACSVantage dual-parameter dot plots of a fecal sample from adult A stained with SYTO BC and PI. A region (R1) was defined around the whole cell population in the dot plot on the left. In the dot plot on the right, regions were set around target populations as follows: SYTO BC-stained cells (R2), double-stained cells (R3), and PI-stained cells. A gate was defined whereby any particle present within R1 and R2 was sorted as a live cell, any particle present within R1 and R3 was sorted as an injured cell, and any particle present within R1 and R4 was sorted as a dead cell. Sorted cells were recovered in separate sterile tubes for a range of 1 × 10⁶ to 5 × 10⁶ cells.
FIG. 3.
FIG. 3.
Sorting purity of recovered fractions. A fecal sample was stained with PI and SYTO BC. Sorted cells were reanalyzed with the FACSClaibur as shown in the panels at the bottom.
FIG. 3.
FIG. 3.
Sorting purity of recovered fractions. A fecal sample was stained with PI and SYTO BC. Sorted cells were reanalyzed with the FACSClaibur as shown in the panels at the bottom.
FIG. 4.
FIG. 4.
DGGE of PCR amplicons of the V6 to V8 regions of the 16S rRNA gene, obtained from a total fecal sample (lanes 1) and sorted viable (lanes 2), dead (lanes 3), and injured (lanes 4) subpopulations from adults A to D. Lanes M contained the marker. Bands that were sequenced are indicated by numbered arrowheads (see Fig. 7).
FIG. 5.
FIG. 5.
Dendrograms based on the DGGE gel for each individual were generated by using the Pearson correlation index for each pair of lanes within a gel and were used as a measure of similarity between the community fingerprints. The clustering of patterns was calculated using the unweighted-pair group method using average linkages.
FIG. 6.
FIG. 6.
DGGE profiles of bifidobacterial PCR products of fecal samples from the four healthy adults (A, B, C, and D). Lanes 1, total fecal bacteria before sorting; lanes 2, live fecal bacteria; lanes 3, dead fecal bacteria; lanes 4, injured cells. The dominant fragments indicated by numbered arrowheads were sequenced and compared to known sequences in the GenBank database, as shown in the phylogenetic tree in Fig. 8.
FIG. 7.
FIG. 7.
Phylogenetic tree of partial 16S rRNA sequences based on E. coli positions 968 to 1376 retrieved from total sorted viable (L), injured (I), and dead (D) fractions from fecal samples from adult A and adult C and full-length reference sequences. The alignment and phylogenetic analysis were performed with the ARB software (29), and the tree was constructed using the neighbor-joining method (41) based on alignment positions conserved in at least 50% of the sequences analyzed. Bar = 10% diversity.
FIG. 8.
FIG. 8.
Phylogenetic tree of bifidobacterial sequences based on E. coli positions 164 to 694. The alignment and phylogenetic analysis were performed with the ARB software (29), and the tree was constructed using the neighbor-joining method (41) based on alignment positions conserved in at least 50% of the sequences analyzed. Bar = 10% diversity. The GenBank accession numbers of reference sequences are indicated. Letters in designations: A, adult A; C, adult C; T, total fecal cells; L, sorted live fraction; I, sorted injured cells; D, sorted dead cells.

References

    1. Altschul, S. F., W. Gish, W. Miller, E. W. Myers, and D. J. Lipman. 1990. Basic local alignment search tool. J. Mol. Biol. 215:403-410. - PubMed
    1. Amann, R. I., B. Binder, R. Olson, S. W. Chisholm, R. Devereux, and D. Stahl. 1990. Combination of 16S rRNA-targeted oligonucleotide probes with flow cytometry for analyzing mixed microbial populations. Appl. Environ. Microbiol. 56:1919-1925. - PMC - PubMed
    1. Apajalahti, J. H. A., A. Kettunen, P. H. Nurminen, H. Jatila, and W. E. Holben. 2003. Selective plating underestimates abundance and shows differential recovery of bifidobacterial species from human feces. Appl. Environ. Microbiol. 69:5731-5735. - PMC - PubMed
    1. Bäckhed, F., R. E. Ley, J. L. Sonnenburg, D. A. Peterson, and J. I. Gordon. 2005. Host-bacterial mutualism in the human intestine. Science 307:1915-1920. - PubMed
    1. Barbesti, S., S. Citterio, M. Labra, M. D. Baroni, M. G. Neri, and S. Sgorbati. 2000. Two- and three-color fluorescence flow cytometric analysis of immunoidentified viable bacteria. Cytometry 40:214-218. - PubMed

Publication types

MeSH terms

Substances