. 2005 Aug 16;44(32):10926-34.
doi: 10.1021/bi050645h.

Two-dimensional measurement of proton T1rho relaxation in unlabeled proteins: mobility changes in alpha-bungarotoxin upon binding of an acetylcholine receptor peptide

Affiliations

Two-dimensional measurement of proton T1rho relaxation in unlabeled proteins: mobility changes in alpha-bungarotoxin upon binding of an acetylcholine receptor peptide

Abraham O Samson et al. Biochemistry. .

Abstract

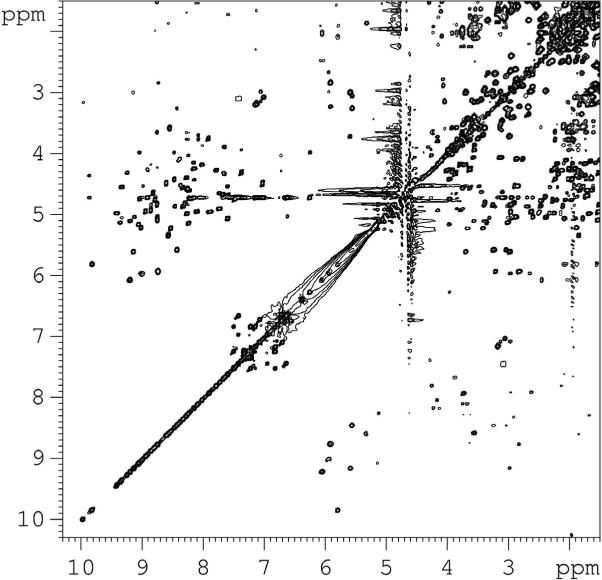
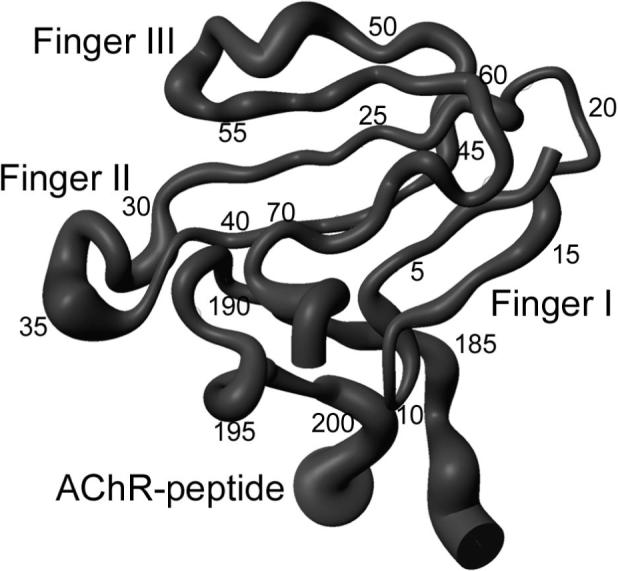
A method for the measurement of proton T(1)(rho) relaxation times in unlabeled proteins is described using a variable spin-lock pulse after the initial nonselective 90 degrees excitation in a HOHAHA pulse sequence. The experiment is applied to alpha-bungarotoxin (alpha-BTX) and its complex with a 25-residue peptide derived from the acetylcholine receptor (AChR) alpha-subunit. A good correlation between high T(1)(rho) values and increased local motion is revealed. In the free form, toxin residues associated with receptor binding according to the NMR structure of the alpha-BTX complex with an AChR peptide and the model for alpha-BTX with the AChR [Samson, A. O., et al. (2002) Neuron 35, 319-332] display high mobility. When the AChR peptide binds, a decrease in the relaxation times and the level of motion of residues involved in binding of the receptor alpha-subunit is exhibited, while residues implicated in binding gamma- and delta-subunits retain their mobility. In addition, the quantitative T(1)(rho) measurements enable us to corroborate the mapping of boundaries of the AChR determinant strongly interacting with the toxin [Samson, A. O., et al. (2001) Biochemistry 40, 5464-5473] and can similarly be applied to other protein complexes in which peptides represent one of the two interacting proteins. The presented method is advantageous because of its simplicity, generality, and time efficiency and paves the way for future investigation of proton relaxation rates in small unlabeled proteins.


Figures

Figure 1
Figure 1
T-filtered HOHAHA spectrum of free α-BTX. The spectrum was measured on an 800 MHz spectrometer at 30°C with a spin-lock pulse applied after the initial 90° pulse. The duration of the spin-lock pulse was 25 msec. Notice the absence of the majority of the HN(F2)/Hα(F1) cross-peaks due to the water suppression scheme.
Figure 2
Figure 2
A single exponential fit to the proton T relaxation data. Single exponential fit to the decay of cross-peak intensity for residues BQ71, BG19, BS34, and BV57 of unbound α-BTX is plotted as a function of the spin-lock duration. The spectra used for this analysis were recorded at 30 °C on an 800 MHz spectrometer. Errors were estimated from S/N ratios in the spectra. Fitted exponential curves are shown.
Figure 3
Figure 3. Changes in T values of Hα protons in free and bound α-BTX
(A) T values for each residue in the free toxin. Small squares denote the average T of β-sheets residues (37 msec). (B) T values for each residue in the bound toxin. Small squares denote the average T of β-sheets residues (28 msec). Errors in T values are displayed by error bars. (C) The ratio between the T values for each residue in the free and bound α-BTX. Small squares denote ratio between the average T values of the β-sheets residues in the free and bound toxin (1.32). All values were measured on the 800 MHz spectrometer at 30°C. Solid horizontal lines beneath the residue axis indicate β-sheet structure. (D) The fractional decrease in exposed surface area upon complex formation for each α-BTX residue.
Figure 4
Figure 4. Comparison between T values of Hα protons in free and bound AChR-peptide and changes in exposed surface upon binding
(A) T values of each residue in the free AChR peptide. (B) T values for each residue in the AChR peptide in complex with the toxin. The spectra of the free and bound AChR peptide were measured at 30°C on 500 MHz and 800 MHz spectrometers respectively. Errors in T values are displayed by error bars. The average T value of 32.3 msec for the peptide residues in β-strands is denoted in B by small squares, and the 45 msec threshold used to differentiate between the peptide residues interacting with the toxin and those that do not is drawn by a horizontal line. (C) The fractional decrease in exposed surface for residues in the AChR-peptide. Solid lines beneath the residue axis represent β-sheet structure.
Figure 5
Figure 5. T-filtered HOHAHA spectra of the α-BTX/AChR-peptide complex measured with different durations of the WALTZ pulse train
A) A spectrum recorded with a WALTZ pulse train and trim pulses with a total duration of 30 msec. B) A spectrum recorded with a WALTZ pulse train and trim pulses with a WALTZ pulse train and trim pulses with a total duration of 200 msec. In both experiments a spin lock with duration of 25 msec was applied after the initial 90° pulse and prior the evolution period. Notice the fewer Hα cross-peak in spectrum B in comparison with spectrum A.
Figure 6
Figure 6
Variation in T values drawn on the backbone structure of the α-BTX/AChR-peptide complex. The thickness of the Cα trace is proportional to the T values of the toxin and peptide residues.

References

    1. Torchia D, Lyerla J, Quattrone AJ. Molecular dynamics and structure of the random coil and helical states of the collagen peptide, α1-CB2, as determined by 13C magnetic resonance. Biochemistry. 1975;14:887–900. - PubMed
    1. Jardetzky O, Roberts GCK. NMR in molecular biology. Academic Press, Inc.; New York: 1981.
    1. Weiss MA, Eliason JL, States DJ. Dynamic filtering by two-dimensional 1H NMR with application to phage λ repressor. Proc. Natl. Acad. Sci. U S A. 1984;81:6019–23. - PMC - PubMed
    1. Ishima R, Wingfield PT, Stahl SJ, Kaufman JD, Torchia DA. Using amide 1H and 15N transverse relaxation to detect millisecond time-scale motions in perdeuterated proteins: application to HIV-1 protease. J. Am. Chem. Soc. 1998;120:10534–42.
    1. Boulat B, Bodenhausen G. Measurement of proton relaxation rates in proteins. J. Biomol. NMR. 1993;3:335–348.

Publication types