. 2005 Aug 22;272(1573):1669-75.
doi: 10.1098/rspb.2005.3153.

Imitation dynamics predict vaccinating behaviour

Affiliations

Imitation dynamics predict vaccinating behaviour

Chris T Bauch. Proc Biol Sci. .

Abstract

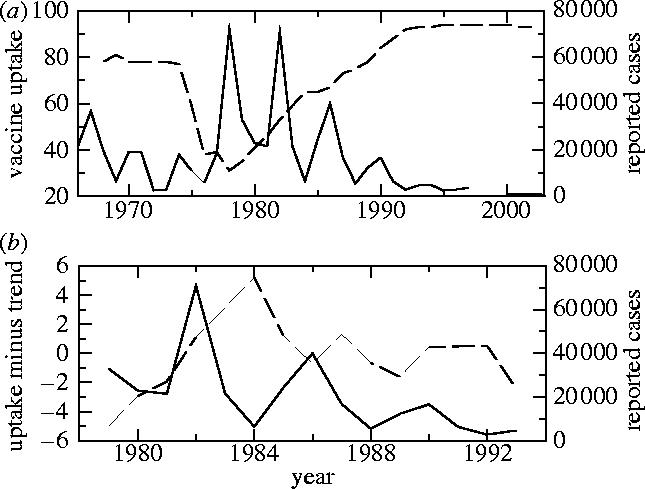
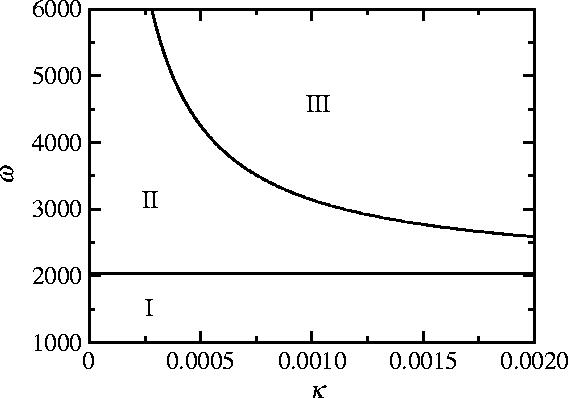
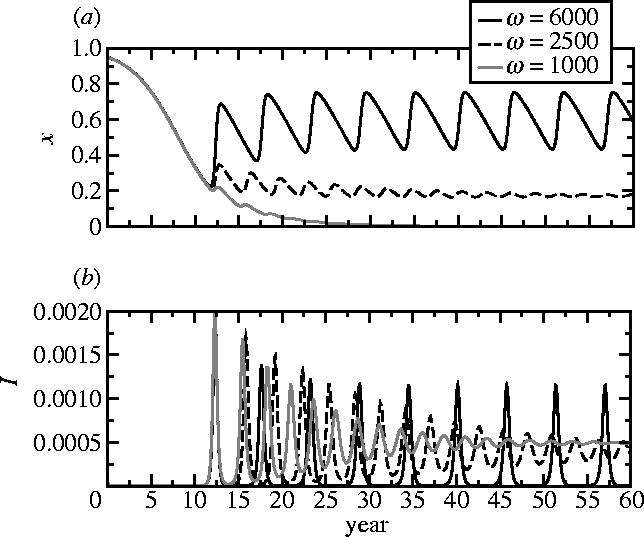
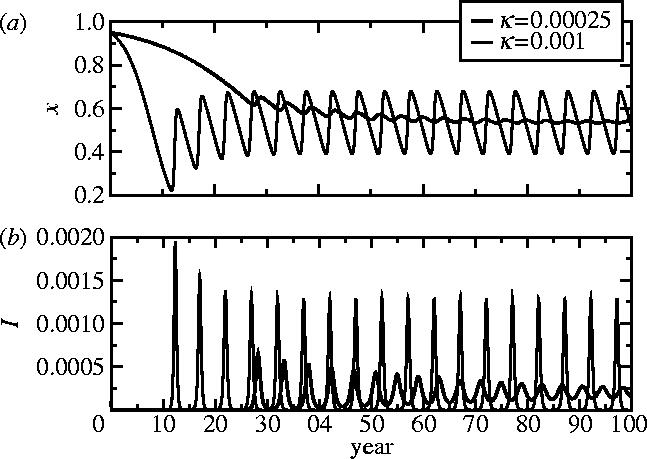
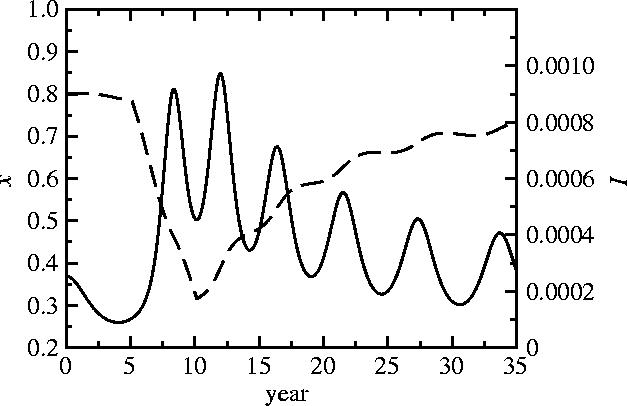
There exists an interplay between vaccine coverage, disease prevalence and the vaccinating behaviour of individuals. Moreover, because of herd immunity, there is also a strategic interaction between individuals when they are deciding whether or not to vaccinate, because the probability that an individual becomes infected depends upon how many other individuals are vaccinated. To understand this potentially complex interplay, a game dynamic model is developed in which individuals adopt strategies according to an imitation dynamic (a learning process), and base vaccination decisions on disease prevalence and perceived risks of vaccines and disease. The model predicts that oscillations in vaccine uptake are more likely in populations where individuals imitate others more readily or where vaccinating behaviour is more sensitive to changes in disease prevalence. Oscillations are also more likely when the perceived risk of vaccines is high. The model reproduces salient features of the time evolution of vaccine uptake and disease prevalence during the whole-cell pertussis vaccine scare in England and Wales during the 1970s. This suggests that using game theoretical models to predict, and even manage, the population dynamics of vaccinating behaviour may be feasible.


Figures

Figure 1
Figure 1
(a) Pertussis vaccine uptake (dashed) and case notifications (solid) in England and Wales from 1967 to 2003 and (b) pertussis vaccine uptake minus a linear least-squares fit (dashed) and case notifications (black) in England and Wales from 1979 to 1993. The vaccine uptake datum at year t is the proportion of children born in year t−2 who completed the recommended course of pertussis immunizations by year t, and the case notification datum at year t is simply the total number of cases reported in that year. Data are from the WHO (2004) and Miller & Gay (1997).
Figure 2
Figure 2
The κ–ω parameter plane for the vaccination game with imitation dynamics, equations (2.10)–(2.12). See text for description of regions I, II and III. Along the Hopf curve dividing regions II and III, κ(ωω0) is a constant. The line ω=ω0 divides regions I and II. Other parameters are R0=10, 1/γ=10 days, 1/μ=50 years.
Figure 3
Figure 3
Representative time-series of x, (a) the frequency of vaccinators, and (b) I, the disease prevalence, from regions I, II and III of the κ–ω parameter plane, for three values of ω. Other parameters are 1/μ=50 years, 1/γ=10 days, R0=10, κ=0.001. Initial conditions are S=0.05, I=0.0001, x=0.95. Given that immigration of infected individuals becomes important in the inter-epidemic troughs, a term +α is included for these time-series in equation (2.10), and a term −α in equation (2.12), where α=10−8 day−1.
Figure 4
Figure 4
Representative time-series of x, (a) the frequency of vaccinators, and (b) I, the disease prevalence, from regions II and III of the κ–ω parameter plane, for two values of κ. Other parameters are 1/μ=50 years, 1/γ=10 days, R0=10, ω=5000, α=10−8 day−1 (see figure 3 caption). Initial conditions are S=0.05, I=0.0001, x=0.95.
Figure 5
Figure 5
A simulated pertussis vaccine scare, with time-series of frequency of vaccinators x (dashed line; equivalent to vaccine uptake in figure 1a) and disease prevalence I (solid line; equivalent to case reports in figure 1a). Parameters are R0=15, 1/γ=22 days, 1/μ=50 years, κ=0.002, ω=5000; these parameter values yield a mean vaccine uptake and period of oscillation similar to that observed in England and Wales before the whole-cell pertussis vaccine scare of the 1970s (figure 1; Bauch & Earn 2003). The population is near the equilibrium E4 at t=0 years. At t=5 years, the perceived vaccine risk rv is increased eightfold in order to produce a decline similar to that observed in England and Wales from 1973 to 1978. At t=10 years, the pre-scare value of rv is restored.

References

    1. Afzal M, Minor P, Schild G. Clinical safety issues of measles, mumps and rubella vaccines. Bull. WHO. 2000;78:199–204. - PMC - PubMed
    1. Albert M.R, Ostheimer K.G, Breman J.G. The last smallpox epidemic in Boston and the vaccination controversy, 1901–1903. N. Engl. J. Med. 2001;344:375–379. - PubMed
    1. Anderson R.M, May R.M. Oxford University Press; 1991. Infectious diseases of humans.
    1. Andre F. Vaccinology: past achievements, present roadblocks and future promises. Vaccine. 2003;21:593–595. - PubMed
    1. Asch D.A, Baron J, Hershey J.C, Kunreuther H, Meszaros J, Ritov I, Spranca M. Omission bias and pertussis vaccination. Med. Decis. Making. 1994;14:118–123. - PubMed

Publication types