

Comparative Study
doi: 10.1098/rstb.2005.1637.
Comparing functional connectivity via thresholding correlations and singular value decomposition
Affiliations
- PMID: 16087436
- PMCID: PMC1854921
- DOI: 10.1098/rstb.2005.1637
Item in Clipboard
Comparative Study
Comparing functional connectivity via thresholding correlations and singular value decomposition
Philos Trans R Soc Lond B Biol Sci.
.
Abstract
We compare two common methods for detecting functional connectivity: thresholding correlations and singular value decomposition (SVD). We find that thresholding correlations are better at detecting focal regions of correlated voxels, whereas SVD is better at detecting extensive regions of correlated voxels. We apply these results to resting state networks in an fMRI dataset to look for connectivity in cortical thickness.
Figures

Focal connectivity by (a) t statistic for correlation with a seed voxel and (b) PCA. The thresholded t statistic (equivalent to thresholding the correlation) clearly shows the correlated focal regions, but the PCA shows nothing.

Extensive connectivity by (a) t statistic for correlation with a seed voxel and (b) PCA. The thresholded t statistic (equivalent to thresholding the correlation) shows no statistically significant evidence of connectivity, but the PCA clearly shows the connected regions (red).
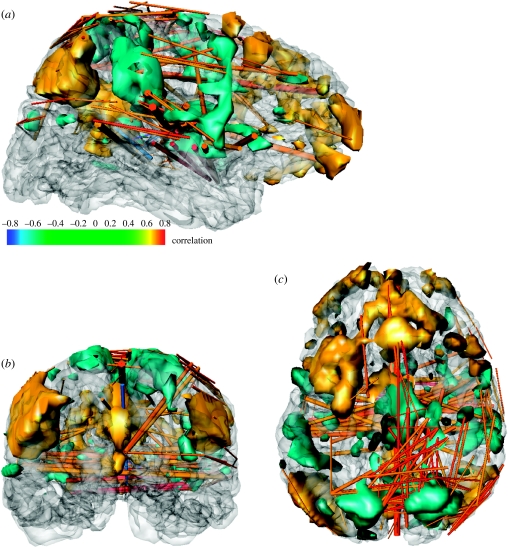
fMRI resting state network. Inside the mid-cortical surface (transparent), the first principal component of the whitened residuals is thresholded at ±0.5 of its maximum value (yellow, blue-green blobs). The ends of the rods join voxels where the auto-correlation SPM C of fMRI residuals exceeded t=±0.7 (higher than the p=0.05 threshold of t=±0.563). Only six-dimensional local maxima are shown. Red rods indicate positively correlated voxels; blue rods indicate negatively correlated voxels (there is only one). Note that the red rods tend to join similarly coloured principal component regions, mostly the blue-green blobs.

Connectivity of cortical thickness. (a) Cortical thickness of one subject, smoothed by 20 mm, plotted on the average of the N=321 mid-cortical surfaces. (b) First principal component of the subject×node matrix of residuals removing a gender effect. The ends of the rods join nodes where the auto-correlation SPM C of cortical thickness exceeded t=±0.338 (n=319 d.f., p=0.05, corrected). Only four-dimensional local maxima inside the same hemisphere are shown. (c) Back view, and colour bar: yellow to red rods indicate positively correlated nodes; blue rods indicate negatively correlated nodes. (d) Top view. Note that red rods tend to join similarly coloured principal component regions, whereas blue rods tend to join differently coloured principal component regions. (e,f) same as (c,d) but removing an age effect and age–gender interaction (n=317), which also removes some of the effective connectivity.
References
-
- Baumgartner R, Ryner L, Richter W, Summers R, Jarmasz M, Somorjai R. Comparison of two exploratory data analysis methods for fMRI: fuzzy clustering vs. principal component analysis. Magn. Reson. Imaging. 2000;18:89–94. - PubMed
-
- Cao J, Worsley K.J. The geometry of correlation fields, with an application to functional connectivity of the brain. Ann. Appl. Probab. 1999;9:1021–1057.
-
- Cordes D, Haughton V, Carew J.D, Arfanakis K, Maravilla K. Hierarchical clustering to measure connectivity in fMRI resting-state data. Magn. Reson. Imaging. 2002;20:305–317. - PubMed
-
- Gonçalves M.S, Hall D.A. Connectivity analysis with structural equation modelling: an example of the effects of voxel selection. NeuroImage. 2003;20:1455–1467. - PubMed
-
- Goto R, et al. Normal aging and sexual dimorphism of Japanese brain. NeuroImage. 2001;13(Suppl. 1):794.
Publication types
MeSH terms
LinkOut - more resources
Full Text Sources
Medical