Comparative Study
. 2005 May 29;360(1457):969-81.
doi: 10.1098/rstb.2005.1654.

Estimating brain functional connectivity with sparse multivariate autoregression

Affiliations
Comparative Study

Estimating brain functional connectivity with sparse multivariate autoregression

Pedro A Valdés-Sosa et al. Philos Trans R Soc Lond B Biol Sci. .

Abstract

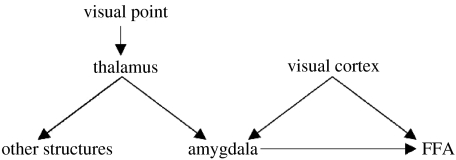
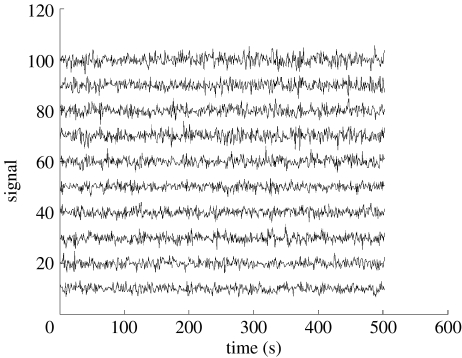
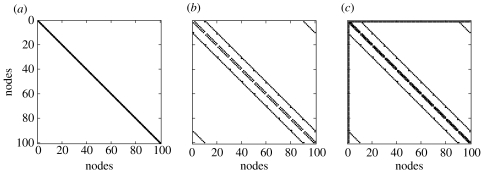
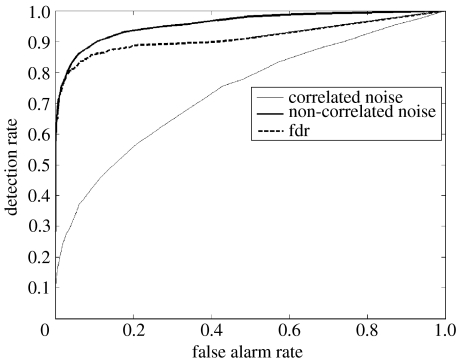
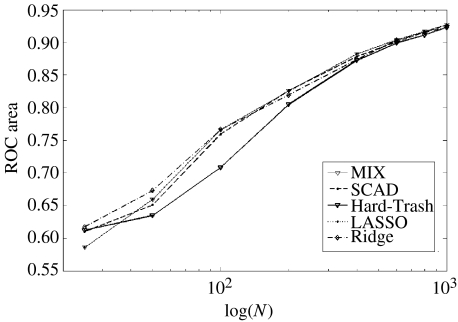
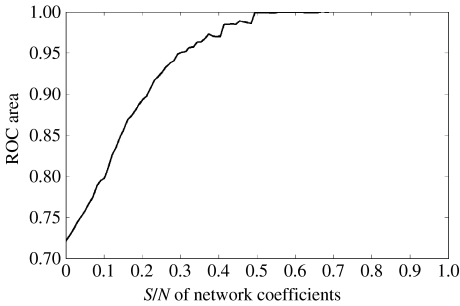
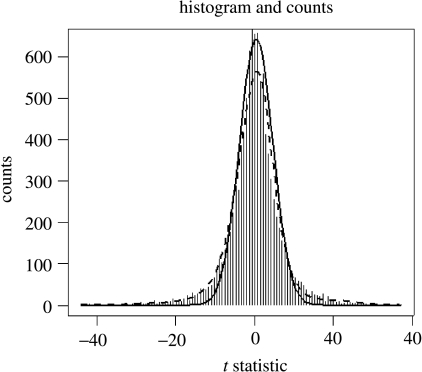
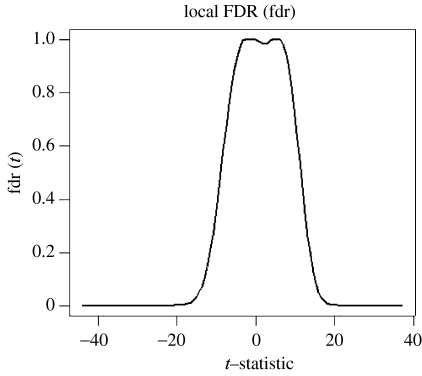
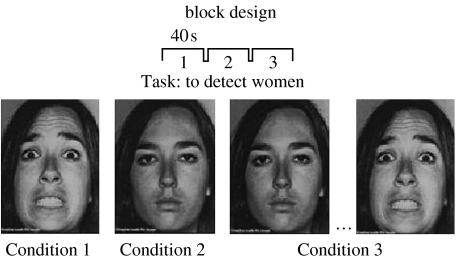
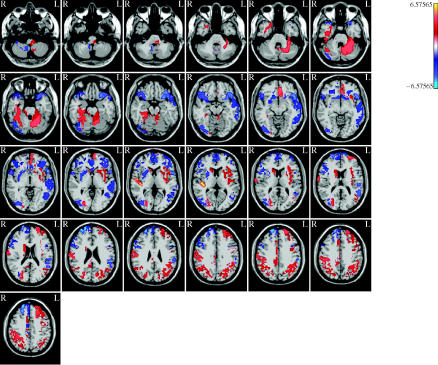
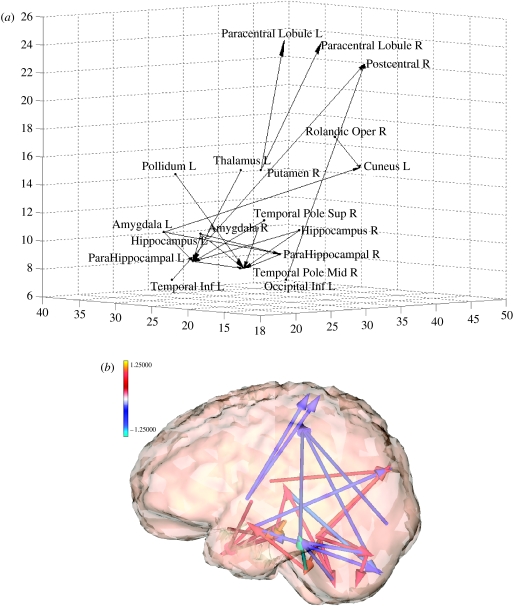
There is much current interest in identifying the anatomical and functional circuits that are the basis of the brain's computations, with hope that functional neuroimaging techniques will allow the in vivo study of these neural processes through the statistical analysis of the time-series they produce. Ideally, the use of techniques such as multivariate autoregressive (MAR) modelling should allow the identification of effective connectivity by combining graphical modelling methods with the concept of Granger causality. Unfortunately, current time-series methods perform well only for the case that the length of the time-series Nt is much larger than p, the number of brain sites studied, which is exactly the reverse of the situation in neuroimaging for which relatively short time-series are measured over thousands of voxels. Methods are introduced for dealing with this situation by using sparse MAR models. These can be estimated in a two-stage process involving (i) penalized regression and (ii) pruning of unlikely connections by means of the local false discovery rate developed by Efron. Extensive simulations were performed with idealized cortical networks having small world topologies and stable dynamics. These show that the detection efficiency of connections of the proposed procedure is quite high. Application of the method to real data was illustrated by the identification of neural circuitry related to emotional processing as measured by BOLD.


Figures

Figure 1
Figure 1
Directed graphical model of a (hypothetical) brain-causal network. Each node in the graph denotes a brain structure. An arrow between two nodes indicates that one structure (parent) exerts a causal influence on another node (child), a relation also known as ‘effective connectivity’. For functional images (EEG or fMRI), observations at each node are time-series. It should be noted that, optimally, time-series from all brain regions should be analysed simultaneously. Ignoring, for example, the amygdala might lead to erroneous conclusions about the influence of visual cortex on FFA, if only the latter were observed. A necessary (but not sufficient) condition for effective connectivity is that knowledge of activity in the parent improves prediction in the child (Granger causality). It is assumed that the set of directed links in real networks is sparse and therefore can be recovered by regression techniques that enforce this property.
Figure 2
Figure 2
Penalization functions used for the iterative estimation of sparse causal relations. At each step of the iterative process, the regression coefficients of each node with all others are weighted according to their current size. Many coefficients are successively down-weighted and ultimately set to zero—effectively carrying out variable selection. y-Axis: weight according to current value of a regression coefficient β (x-axis). Each curve corresponds to a different type of penalization: heavy line, L2 norm (ridge regression); dashed, L1 norm (LASSO). Dotted, Hard-Threshold; dash-dot, SCAD; light line, mixture.
Figure 3
Figure 3
Idealized cortical models used to test regression methods for the identification of sparse graphs were simulated by a ‘small world’ network topology. Nodes resided on a two-dimensional grid on the surface of a torus, thus imposing periodic boundary conditions in the plane. For each simulation, a set of directed connections was first formed with a distribution crafted to induce the ‘small world effect’. The strengths of the connections between parents and children were sampled from a Gaussian distribution. Directed links are shown on the surface of the torus for one sample network.
Figure 4
Figure 4
Connectivity structure of the simulated cortical network shown in figure 3. This type of small-world network has a high probability of connections between geographical neighbours and a small proportion of larger range connections. The network mean connectivity was: 6.23; the scaled clustering: 0.87; the scaled length: 0.19. (a) Two-dimensional view of the links between nodes. (b) Connectivity (0–1) matrix in with a row for each node and non-zero elements for its children.
Figure 5
Figure 5
Simulated fMRI time-series generated by a first order multivariate autoregressive model yt=A1yt1+et, the autoregressive matrix being sampled as described in figures 3 and 4. The innovations et (noise input) were sampled from a Gaussian distribution with a prescribed inverse covariance matrix Σ-1 as described in figure 6. Y-axis: simulated BOLD signal, x-axis: time. The effect of different observed lengths of time-series (N) on the detection of connections was studied.
Figure 6
Figure 6
Connectivity matrices for the precisions Σ−1. Three situations were explored: (a) spatial independence with a diagonal precision matrix, (b) nearest-neighbour dependency with partial autocorrelations existing only between nodes close to each other, (c) nearest-neighbour topology with a ‘master’ node linked to all other nodes in the network.
Figure 7
Figure 7
Efficiency of ridge regression for the detection of causal connections in simulated fMRI from a network with p=100 nodes and a recorded length of Nt=200 time points, as measured by receiver operating curves (ROC). y-Axis: probability of detection of true connections, x-axis: probability of false detections. The dark line corresponds to an fMRI generated with spatially independent noise as well as with a high signal to noise ratio. The thin line corresponds to a time-series generated with spatially correlated noise (nearest neighbour), as well as with a low signal to noise ratio. Note the decreases of detection efficiency with these factors. The dashed line shows the performance of the local false discovery rate thresholds calculated without knowledge of the true topology of the network. Note the excellent correspondence at low false-positive rates.
Figure 8
Figure 8
Effect of the ratio of network size (p) to temporal sample size (Nt) on the detection efficiency for different penalized regression methods. The number of nodes in the network was kept at p=100. y-Axis: area under ROC curve. x-Axis: sample size (N). Though efficiency decreases with smaller sample sizes, all methods perform well above chance even for p=4N. Ridge regression dominates the other methods for p=N with no significant differences at other p/Nt ratios
Figure 9
Figure 9
Effect of signal to noise ratio of network connectivity generation on efficiency of detection by LASSO. y-Axis: area under the ROC, x-axis: signal to noise ratio.
Figure 10
Figure 10
The local FDR (fdr) is ideal for the detection of sparse connections. If there are few connections, then testing for links between all nodes should lead to a sample of test statistics for which the null hypothesis predominates. The distribution of the statistics can therefore be modelled as a mixture of the density of null hypothesis with that of the alternative hypothesis. These are separated by non-parametric density estimation as shown in this figure, in which the thick line denotes the estimated null distribution and the thin one the estimated alternative distribution for the ridge regression example shown in figure 7 (thick line). y-Axis: counts, x-axis: values of the t statistics for estimated regression coefficients.
Figure 11
Figure 11
The local false discovery of the ridge regression example of figure 7. y-Axis: fdr, x-axis: t statistic for estimated regression coefficients.
Figure 12
Figure 12
fMRI acquisition: the experimental paradigm consisted of visual stimuli presented under three conditions. Condition 1, static fearful faces, (SFF); Condition 2, neutral faces (with no emotional content), (NF); Condition 3, dynamic fearful faces (in this condition faces are morphed from neutral emotional content to fear; DFF). A general linear model was posited that included not only a different mean level μC vector, but also a different autoregressive matrix A1C for each condition C. Thus, the model explores changes across voxels not only of mean level of activity but also of connectivity patterns.
Figure 13
Figure 13
Tomography of t statistics contrasting fearful face means (μSFF+μDFF)/2 with that of neutral faces μNF. t-Values are obtained by Bayesian ridge regression and thresholded using the local FDR (fdr) as explained in figures 10 and 11. Note the activation of the FFA which was very similar to that obtained with the SPM package.
Figure 14
Figure 14
(a) Graph of connections that change with appearance of fearful expression. Obtained by element wise comparison of the autoregressive matrices of fearful faces (A1SFF+A1DFF)/2 as compared with that of neutral faces (A1NF). Only those connections above the fdr threshold are shown. Note involvement of areas related to emotional responses. (b) Three-dimensional rendering of the connectivity patterns shown in (a).

Similar articles

Cited by

References

    1. Albert R, Barabasi A.L. Statistical mechanics of complex networks. Rev. Modern Phys. 2002;74:47–97.
    1. Baccala L.A, Sameshima K. Partial directed coherence: a new concept in neural structure determination. Biol. Cybern. 2001;84:463–474. - PubMed
    1. Bach F.R, Jordan M.I. Learning graphical models for stationary time series. IEEE Trans. Signal Proc. 2004;52:2189–2199.
    1. Benjamini Y, Hochberg Y. Controlling the false discovery rate—a practical and powerful approach to multiple testing. J. R. Stat. Soc. B Methodological. 1995;57:289–300.
    1. Brillinger D.R, Bryant H.L, Segundo J.P. Identification of synaptic interactions. Biol. Cybern. 1976;22:213–228. - PubMed

Publication types