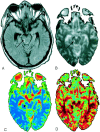
MR diffusion tensor imaging, fiber tracking, and single-voxel spectroscopy findings in an unusual MELAS case
- PMID: 16091539
- PMCID: PMC7975162
MR diffusion tensor imaging, fiber tracking, and single-voxel spectroscopy findings in an unusual MELAS case
Abstract
A 23-year-old man was admitted to the intensive care unit for respiratory failure, global lower and upper limb palsy, and higher cognitive function deterioration. Imaging, performed with a combination of the MR diffusion tensor imaging, fiber tracking, and MR spectroscopy, suggested the diagnosis of an acute severe unusual mitochondrial encephalopathy, lactic acidosis, and strokelike event, which was confirmed by muscle biopsy, but fiber tracking showed unexpected unaltered white matter tracts.
Figures


Similar articles
-
Diffusion-weighted MR imaging in a case of mitochondrial myopathy, encephalopathy, lactic acidosis, and strokelike episodes.AJNR Am J Neuroradiol. 2001 Feb;22(2):269-72. AJNR Am J Neuroradiol. 2001. PMID: 11156767 Free PMC article.
-
[Conventional and diffusion-weighted magnetic resonance imaging and proton spectroscopy in MELAS].Acta Med Port. 2012;25 Suppl 1:59-64. Epub 2012 Nov 2. Acta Med Port. 2012. PMID: 23177587 Portuguese.
-
MR diffusion tensor imaging and fiber tracking in 5 spinal cord astrocytomas.AJNR Am J Neuroradiol. 2006 Jan;27(1):214-6. AJNR Am J Neuroradiol. 2006. PMID: 16418387 Free PMC article.
-
Mitochondrial myopathy, encephalopathy, lactic acidosis, and strokelike episodes (MELAS): current concepts.J Child Neurol. 1994 Jan;9(1):4-13. doi: 10.1177/088307389400900102. J Child Neurol. 1994. PMID: 8151079 Review.
-
Diffusion tensor magnetic resonance imaging and fiber tracking in spinal cord lesions: current and future indications.Neuroimaging Clin N Am. 2007 Feb;17(1):137-47. doi: 10.1016/j.nic.2006.11.005. Neuroimaging Clin N Am. 2007. PMID: 17493544 Review.
Cited by
-
Tract-based spatial statistical analysis of diffusion tensor imaging in pediatric patients with mitochondrial disease: widespread reduction in fractional anisotropy of white matter tracts.AJNR Am J Neuroradiol. 2012 Oct;33(9):1726-30. doi: 10.3174/ajnr.A3045. Epub 2012 Apr 12. AJNR Am J Neuroradiol. 2012. PMID: 22499843 Free PMC article.
-
Apparent diffusion coefficients of metabolites in patients with MELAS using diffusion-weighted MR spectroscopy.AJNR Am J Neuroradiol. 2011 May;32(5):898-902. doi: 10.3174/ajnr.A2395. Epub 2011 Feb 24. AJNR Am J Neuroradiol. 2011. PMID: 21349966 Free PMC article.
-
Short-term evolution of spinal cord damage in multiple sclerosis: a diffusion tensor MRI study.Neuroradiology. 2012 Oct;54(10):1171-8. doi: 10.1007/s00234-012-1057-1. Epub 2012 Jun 26. Neuroradiology. 2012. PMID: 22732908 Clinical Trial.
-
Conventional MRI and MR spectroscopy in nonclassical mitochondrial disease: report of three patients with mitochondrial DNA deletion.Childs Nerv Syst. 2006 Oct;22(10):1355-9. doi: 10.1007/s00381-006-0082-y. Epub 2006 Mar 22. Childs Nerv Syst. 2006. PMID: 16552564
-
A novel head-neck cooling device for concussion injury in contact sports.Transl Neurosci. 2015 Jan 14;6(1):20-31. doi: 10.1515/tnsci-2015-0004. eCollection 2015. Transl Neurosci. 2015. PMID: 28123788 Free PMC article.
References
-
- Basser P, Pierpaoli C. A simplified method to measure the diffusion tensor from seven MR images. Magn Reson Med 1998;39:928–934 - PubMed
-
- Westin CF, Maier SE, Mamata H, et al. Processing and visualization for diffusion tensor MRI. Med Image Anal 2002;6:93–108 - PubMed
-
- Tanji K, Kunimatsu T, Vu TH, Bonilla E. Neuropathological features of mitochondrial disorders. Semin Cell Dev Biol 2001;12:429–439 - PubMed
Publication types
MeSH terms
LinkOut - more resources
Full Text Sources
