Comparative Study
. 2005 Dec 1;24(54):7976-83.
doi: 10.1038/sj.onc.1208947.

BBC3 mediates fenretinide-induced cell death in neuroblastoma

Affiliations
Comparative Study

BBC3 mediates fenretinide-induced cell death in neuroblastoma

Jun S Wei et al. Oncogene. .

Abstract

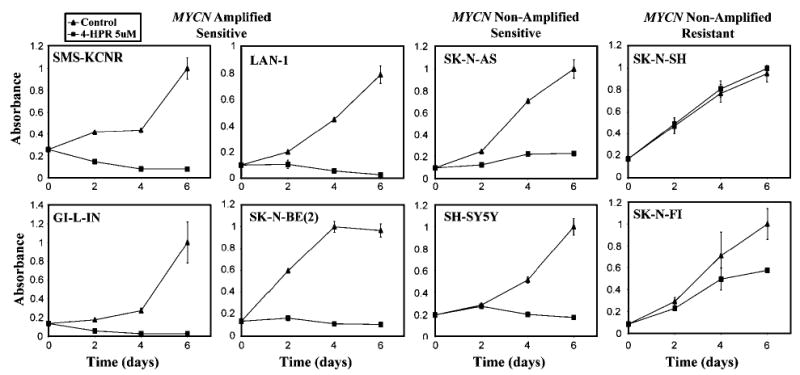
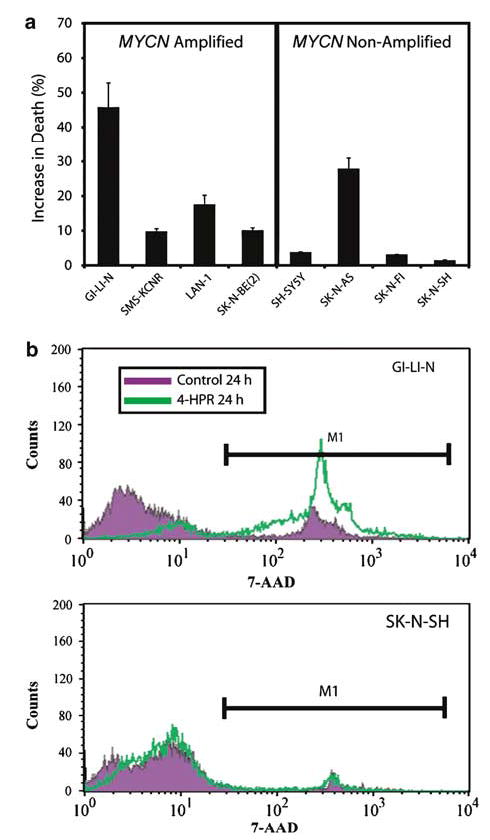
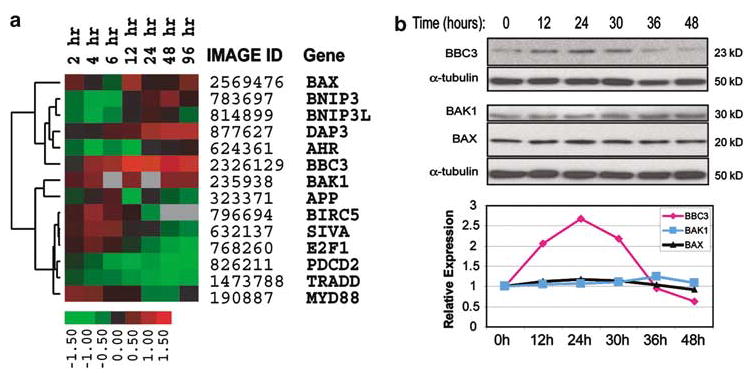
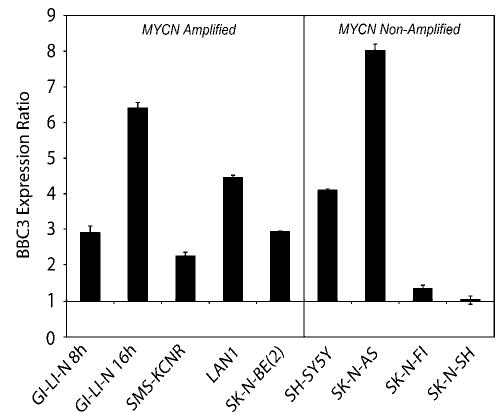
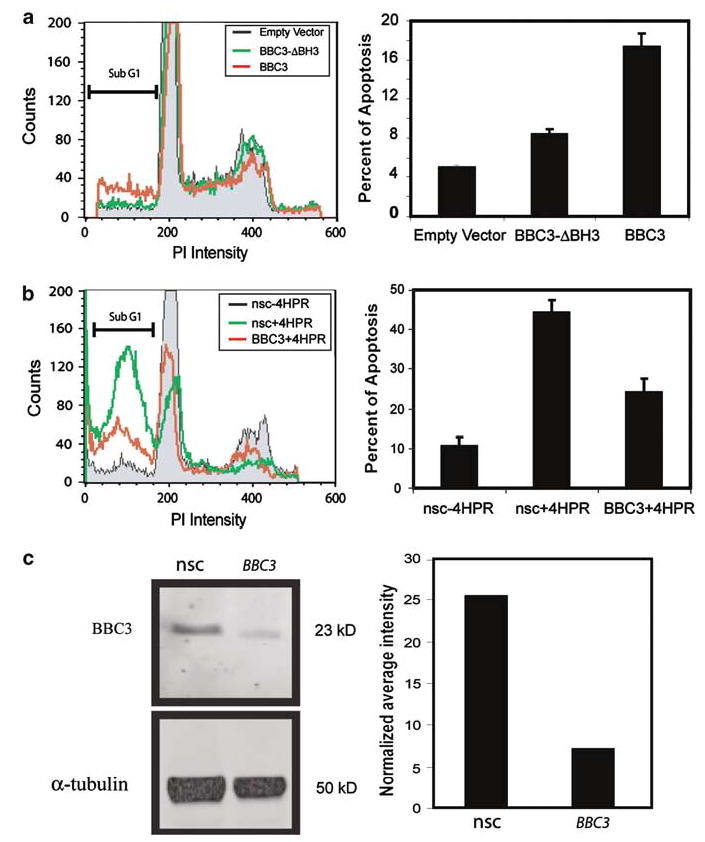
Fenretinide (4-HPR) is a synthetic retinoid whose apoptosis-inducing effects have been demonstrated in many tumor types. The precise mechanism of its apoptotic action is not fully understood. To further study the mechanism by which 4-HPR exerts its biological effects in neuroblastoma (NB) and to identify the genes that contribute to the induction of apoptosis, we determined the sensitivity of eight NB cell lines to 4-HPR. Additionally, cDNA microarray analysis was performed on a 4-HPR-sensitive cell line to investigate the temporal changes in gene expression, primarily focusing on the induction of proapoptotic genes. BBC3, a transcriptionally regulated proapoptotic member of the BCL2 family, was the most highly induced proapoptotic gene. Western analysis confirmed the induction of BBC3 protein by 4-HPR. Furthermore, the induction of BBC3 was associated with the sensitivity to this agent in the cell lines tested. Finally we demonstrated that BBC3 alone is sufficient to induce cell death in the 4-HPR-sensitive and resistant NB cell lines, and that siRNA against BBC3 significantly decreases apoptosis induced by 4-HPR. Our results indicate that BBC3 mediates cell death in NB cells in response to 4-HPR.


Figures

Figure 1
Figure 1
Cell growth assay (WST-1) of the eight NB cell lines. A total of 5000 cells were seeded into a 96-wells microplate in 200 μl of medium. Three replicated wells were set up for each time point, and absorbance was measured at 2, 4 and 6 days for both control and experimental samples. The absorbance values were normalized to 1, and the error bars represent the standard errors. All cell lines except SK-N-SH and SK-N-FI were sensitive to 4-HPR
Figure 2
Figure 2
Viability assay of the eight NB cell lines. (a) Cell death was measured for all eight cell lines with 7-AAD vital dye after 24 h exposure with 5 μm 4-HPR. Experiments were done in triplicate with standard error shown. (b) Representative histograms from GI-LI-N and SK-N-SH stained with 7-AAD after 24 h exposure to 5 μm 4-HPR are shown. GI-LI-N had a 45% increase in cell death compared to control, whereas SK-N-SH had only a 1% increase. Therefore, 4-HPR induces cell death in sensitive NB cell lines
Figure 3
Figure 3
Expression of apoptotic genes induced by 4-HPR in NB cells. (a) Hierarchical clustering of apoptosis-related genes with ⩾2-fold induction of mRNA in the time course experiments in the 4-HPR sensitive SMS-KCNR cell line. Cells were treated with 5 μm 4-HPR for 2, 4, 6, 8, 12, 24, 48 and 96 h. The heat map represents gene expression ratios: red indicates upregulation, green represents downregulation, and black indicates no change. The ratio color scale indicates the log2 ratios. Low-quality cDNA spots (spot quality <0.5, see Materials and methods) were marked with gray. (b) Fenretinide-induced transient upregulation of BBC3 in SH-SY5Y cells. In a time course experiment, protein samples were extracted from SH-SY5Y cells at 0, 12, 24, 30, 36 and 48 h after exposure to 5 μm 4-HPR. An amount of 40 μg of protein of each sample was separated on 4–12% Bis–Tris gel and transferred to PVDF membrane. Antibodies against BBC3, BAK1 and BAX were used for Western blotting analysis. An anti-α-tubulin antibody was used for loading control on each Western blot. ImageQuant™ Image Analysis Software v.5.2 was used to quantify protein bands and the relative signal intensities (comparing to time 0) were shown in the plot after correcting for loading. ♦ represents BBC3, ▪ BAK1, and ▴ BAX
Figure 4
Figure 4
Quantitative RT–PCR of BBC3 gene in NB cell lines. Expression levels of BBC3 were measured by quantitative RT–PCR after 8 and 16 h for GI-LI-N, since these cells are exquisitely sensitive to 4-HPR (Ferrari et al., 2003), and 24 h for the remaining cell lines after treatment with 5 μm 4-HPR. Expression for each gene is represented as a ratio between 4-HPR and ethanol control experiments. Error bars represent the standard errors for three independent experiments
Figure 5
Figure 5
BBC3 mediates 4-HPR-induced apoptosis in SH-SY5Y. (a) Exogenous BBC3-induced apoptosis. The left panel shows histograms of representative PI profiles of cells transfected with BBC3 constructs (red), BH3 deletion constructs of BBC3 (green) and empty vectors (black) at 24 h. The right panel shows the percentage of cell apoptosis measured by PI profiling. Three independent experiments were performed, and error bars represent the standard errors. (b) Reduction of BBC3 attenuates 4-HPR-induced apoptosis. SH-SY5Y cells were transfected with siRNA targeting BBC3 or nonsilencing control (nsc), and then treated with 10 μm 4-HPR after 48 h following transfection. PI profiling was performed following an additional 48 h exposure to 4-HPR. Left panel is a representative PI profile of cells transfected with siRNA targeting BBC3 or nsc with 4-HPR treatment (red and green curves, respectively). The gray area is the PI profile of cells transfected with nonsilencing control (nsc) and treated with ethanol alone. Right panel: quantification of the sub-G1 cell populations in each of the three experiments; the knockdown of BBC3 by specific siRNA targeting therefore attenuates 4-HPR induction by 46% compared to nsc siRNA. This panel shows three independent experiments and the error bars represent the standard error. (c) BBC3 siRNA reduced BBC3 protein by 2.6-fold. An amount of 40 μ g of total protein extracted from SH-SY5Y cells after 30 h 4-HPR treatment was separated on 4–12% Bis–Tris gel and transferred to PVDF membrane. Western blots were performed and visualized by a Typhoon 9410 Variable Mode Imager (left panel), and protein bands were quantified by ImageQuant™ Image Analysis Software (right panel). nsc: nonsilencing control

References

    1. Abemayor E, Sidell N. Environ Health Perspect. 1989;80:3–15. - PMC - PubMed
    1. Bouillet P, Strasser A. J Cell Sci. 2002;115:1567–1574. - PubMed
    1. Brodeur GM and Castleberry RP. (1997). Principles and Practice of Pediatric Oncology Pizzo PA and Poplack DG (eds). Lippincott-Raven: Philadelphia. pp 761–797.
    1. Chen Y, Dougherty ER, Bittner ML. Biomed Opt. 1997;2:364–374. - PubMed
    1. Chen Y, Kamat V, Dougherty ER, Bittner ML, Meltzer PS, Trent JM. Bioinformatics. 2002;18:1207–1215. - PubMed

Publication types

MeSH terms