Comparative Study
. 2005 Oct 4;102(40):14142-9.
doi: 10.1073/pnas.0505018102. Epub 2005 Aug 10.

Vitamin A and immune function: retinoic acid modulates population dynamics in antigen receptor and CD38-stimulated splenic B cells

Affiliations
Comparative Study

Vitamin A and immune function: retinoic acid modulates population dynamics in antigen receptor and CD38-stimulated splenic B cells

Qiuyan Chen et al. Proc Natl Acad Sci U S A. .

Abstract

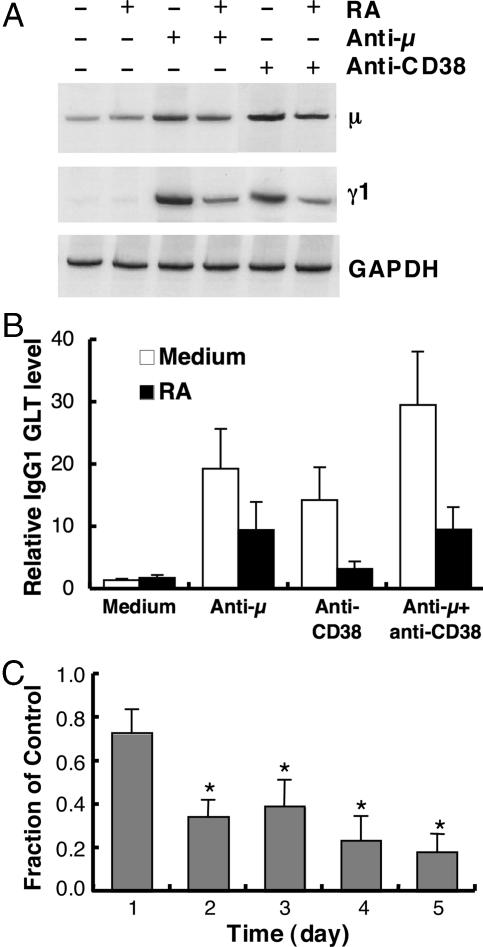
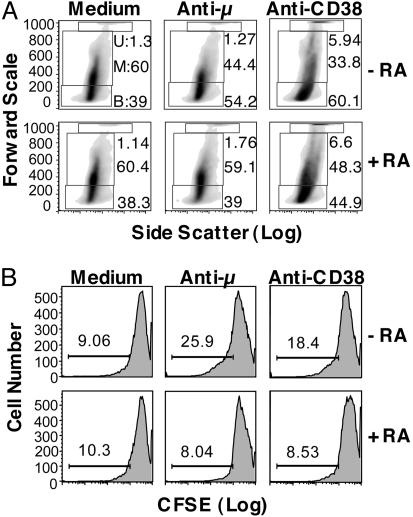
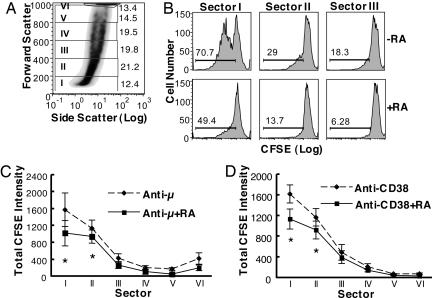
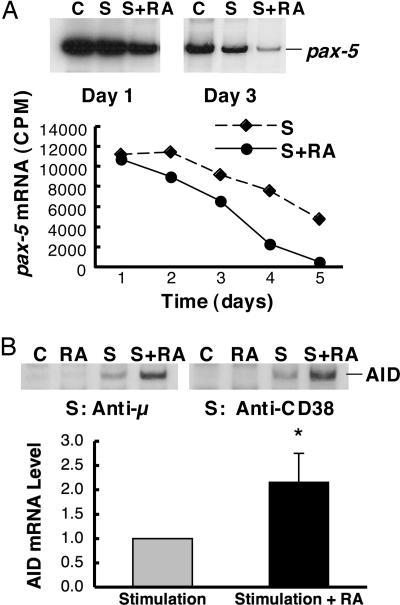
Vitamin A and its active metabolite, all-trans retinoic acid (RA), regulate the antibody response in vivo, although the underlying mechanisms are not well understood. We have investigated the regulation by RA of B cell population dynamics and Ig gene expression in purified splenic mouse B cells stimulated through the B cell antigen receptor (BCR) and/or CD38, a BCR coreceptor. After ligation of the BCR and/or CD38, B cells became more heterogeneous in size. RA substantially restrained this change, concomitant with inhibition of cell proliferation. To examine B cell heterogeneity more closely, we categorized stimulated B cells by size (forward angle light scatter) and determined cell division dynamics, germ-line Ig heavy chain gene transcription and surface IgG1 (sIgG1) expression. Flow cytometric analysis of carboxyfluorescein diacetate succinimidyl ester-labeled B cells costained for sIgG1 showed that the more proliferative groups of B cells were smaller, whereas cells expressing more sIgG1 were larger. RA enriched the latter population, whereas cell division frequency in general and the number of smaller B cells that had undergone division cycles were reduced. Although RA significantly inhibited Ig germ-line transcript levels in the total B cell population, CD19(-)IgG1(+) B cells, which represent a more differentiated phenotype, were enriched. Furthermore, pax-5 mRNA was decreased and activation-induced cytidine deaminase mRNA was increased in RA-treated stimulated B cells. Thus, RA regulated factors known to be required for Ig class switch recombination and modulated the population dynamics of ligation-stimulated B cells, while promoting the progression of a fraction of B cells into differentiated sIgG-expressing cells.


Figures

Fig. 1.
Fig. 1.
RA inhibits BCR and CD38 ligation-induced B cell proliferation. Primary murine B cells were cultured in the presence and absence of a physiological concentration of RA (10 nM) and the stimuli indicated for 72 h. [3H]thymidine was added to the cells in the last 4 h of culture to label the proliferating cells, and [3H]thymidine incorporation was determined. (A) Proliferation of B cells stimulated with low doses of anti-μ.(B) Proliferation of B cells stimulated with anti-CD38. (C) Proliferation of B cells stimulated with anti-CD38 and anti-μ (each 1 μg/ml) in the presence and absence of RA. The data shown represent the mean ± SE for five independent experiments conducted in triplicate. *, P < 0.01.
Fig. 2.
Fig. 2.
RA regulates GL μ and γ1 mRNA levels induced by BCR and CD38 ligation. B cells were cultured as described in Fig. 1 for different times. Cellular total RNA was extracted and subjected to RT-PCR analysis. (A) Representative 33P-labeled PCR product showing the level of expression of μ and γ1 GL mRNA after 48 h of culture. GAPDH mRNA is shown as an internal control of the assay. (B) IgG1 GL transcript level in cells cultured for 48 h. Data were obtained by counting 33P-labeled PCR products and are presented as the mean ± SE from n = 4 independent experiments. (C) The ratio of GL transcript levels [cells cultured with RA (10 nM) compared with control without RA] in B cells stimulated with anti-μ plus anti-CD38 (1 μg/ml of each). *, P < 0.05, compared with day 1.
Fig. 3.
Fig. 3.
Regulation by RA of B cell distribution and cell division (CFSE dilution) elicited by BCR and CD38 ligation. Isolated B cells were labeled with CFSE and cultured for 5 days with and without stimuli (anti-μ or anti-CD38, each 1 μg/ml) and RA (10 nM). Cells were harvested on day 5 and analyzed for CFSE intensity by flow cytometry. (A) FALS versus side scatter plots were used to analyze the data. A representative panel of graphs of the distribution of B cells after treatment is shown. Three arbitrary gates (U, upper; M, middle; B, bottom) were made to divide the cell population according to the forward scatter. (B) Flow cytometric histograms of CFSE dilution in control and stimulated B cells with and without RA; the percentage of cells that had undergone dilution is indicated above the bars.
Fig. 4.
Fig. 4.
B cell division (CFSE dilution) induced by BCR and CD38 ligation is reduced by RA. B cells were labeled with CFSE and cultured for 5 days with and without stimuli (anti-μ or anti-CD38, 1 μg/ml) and RA. Cells were harvested on day 5 and analyzed by flow cytometry for CFSE dilution. (A) A representative graph showing the way the B cell population was divided into six sectors according to forward scatter (every 200 scale units, with the cells clustered at the top as sector VI). (B) The inhibitory effect of RA on anti-μ-induced B cell CFSE dilution, illustrated for sectors I, II, and III as shown in A.(C and D). Charts summarizing studies in which CFSE dilution in each sector of A was determined for B cells stimulated by ligation of the BCR (C) and CD38 (D), with and without RA. *, P < 0.05.
Fig. 5.
Fig. 5.
B cell sIgG1 expression induced by BCR and CD38 ligation is increased by RA. B cells were cultured for 5 days as described in Fig. 4. At the end of culture, cells were stained with a PerCP-labeled anti-IgG1 antibody and subjected to flow cytometric analysis. (A) Graphs showing the percentage of sIgG1-positive cells after BCR and CD38 ligation (1 μg/ml), with and without RA (10 nM). (B) Graphs showing that the majority of IgG1-positive cells were located in sectors III, IV, and V, and RA increased the percentage of IgG1-positive cells in each sector. Anti-μ was used as stimulus in the experiment shown. The dashed line illustrates the isotype control. (C and D) Charts summarizing the data for each sector and treatment. *, P < 0.05.
Fig. 6.
Fig. 6.
RA regulates IgG1 GL mRNA expression in B cells sorted into smaller and larger-sized cell populations. B cells were cultured for 5 days with anti-μ plus anti-CD38 (1 μg/ml each) in the presence and absence of RA (10 nM). Cells were then sorted into two populations [B, bottom gate (similar to sectors I and II), and U, upper gate (similar to sectors III, IV, V, and VI in Figs. 4 and 5, based on FALS)]. Cellular RNA was isolated from these cells and RT-PCR was performed to determine the level of GL IgG1 mRNA (γ1 gene transcription). The expression pattern of the GL γ1 transcript in each treatment is shown by a representative gel of PCR products and 18S RNA as control. The chart summarizes the expression pattern of γ1 transcript in each gate for the treatments shown. **, the significant difference between groups with and without RA; *, the difference between bottom and upper groups, P < 0.05.
Fig. 7.
Fig. 7.
CD19 and sIgG1 expression during BCR and CD38 ligation-induced B cell activation. B cells were cultured for 5 days in the presence and absence of anti-μ plus anti-CD38 (1 μg/ml each) and RA (10 nM). At the time of harvesting each day, surface CD19 and sIgG1 were detected by anti-CD19-PE and anti-IgG1-Alexa 488 antibodies, respectively, and analyzed by flow cytometry. (A) The percentage of CD19+ cells during culture and after stimulation. Con, control; S±RA, stimuli in the presence and absence of RA (which did not differ). (B) The percentage of sIgG1+/CD19- cells. *, the difference between S and S+RA; **, the difference between S and Con. P < 0.05.
Fig. 8.
Fig. 8.
Regulation of pax-5 and AID gene expression during the activation of B cells in the presence of RA. B cells were cultured for different times, as shown, and then total RNA was subjected to RT-PCR analysis to assess pax-5 and AID mRNA levels. (A) Pax-5 expression in anti-μ and anti-CD38-stimulated B cells. (Inset) A gel showing the expression pattern of pax-5 on days 1 and 3 in the presence and absence of treatment. S represents stimulation with anti-μ and anti-CD38 (1 μg/ml for each). S+RA represents stimulation plus RA (10 nM). The chart illustrates pax-5 gene expression (cpm) in BCR and CD38 ligation-activated B cells during the 5-day experiment. (B) AID mRNA in B cells stimulated by anti-μ or anti-CD38, with and without RA, for 48 h. The chart summarizes n = 3 independent experiments. Stimulation represents anti-μ plus anti-CD38 (1 μg/ml for each). Data are presented as the ratio of AID mRNA in RA-treated cells compared with cells without RA. *, P < 0.05.

Comment in

  • Profile of A. Catharine Ross.
    Trivedi B. Trivedi B. Proc Natl Acad Sci U S A. 2005 Oct 4;102(40):14139-41. doi: 10.1073/pnas.0506178102. Epub 2005 Sep 26. Proc Natl Acad Sci U S A. 2005. PMID: 16186491 Free PMC article. No abstract available.

References

    1. Ross, A. C., Zolfaghari, R. & Weisz, J. (2001) Curr. Opin. Gastroenterol. 17, 184-192. - PubMed
    1. Reifen, R. (2002) Proc. Nutr. Soc. 61, 397-400. - PubMed
    1. Semba, R. D. (1999) Proc. Nutr. Soc. 58, 719-727. - PubMed
    1. Semba, R. D., Ndugwa, C., Perry, R. T., Clark, T. D., Jackson, J. B., Melikian, G., Tielsch, J. & Mmiro, F. (2005) Nutrition 21, 25-31. - PubMed
    1. Villamor, E. & Fawzi, W. W. (2005) Clin. Microbiol. Rev. 18, 446-464. - PMC - PubMed

Publication types

MeSH terms