. 2005 Aug 10;25(32):7324-32.
doi: 10.1523/JNEUROSCI.2042-05.2005.

Activity-dependent differential transmitter release in mouse adrenal chromaffin cells

Affiliations

Activity-dependent differential transmitter release in mouse adrenal chromaffin cells

Tiberiu Fulop et al. J Neurosci. .

Abstract

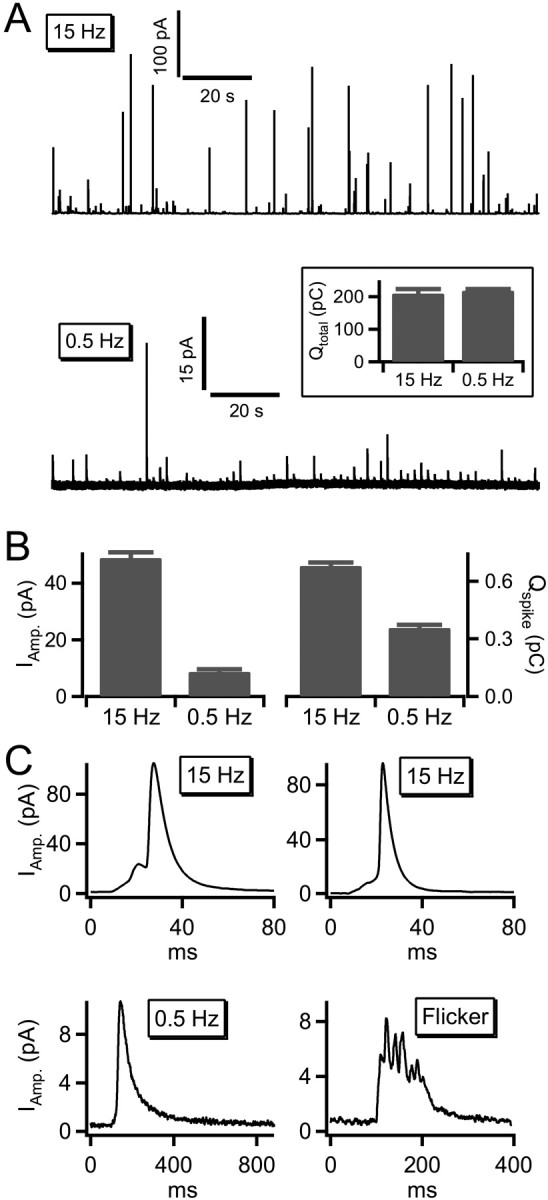
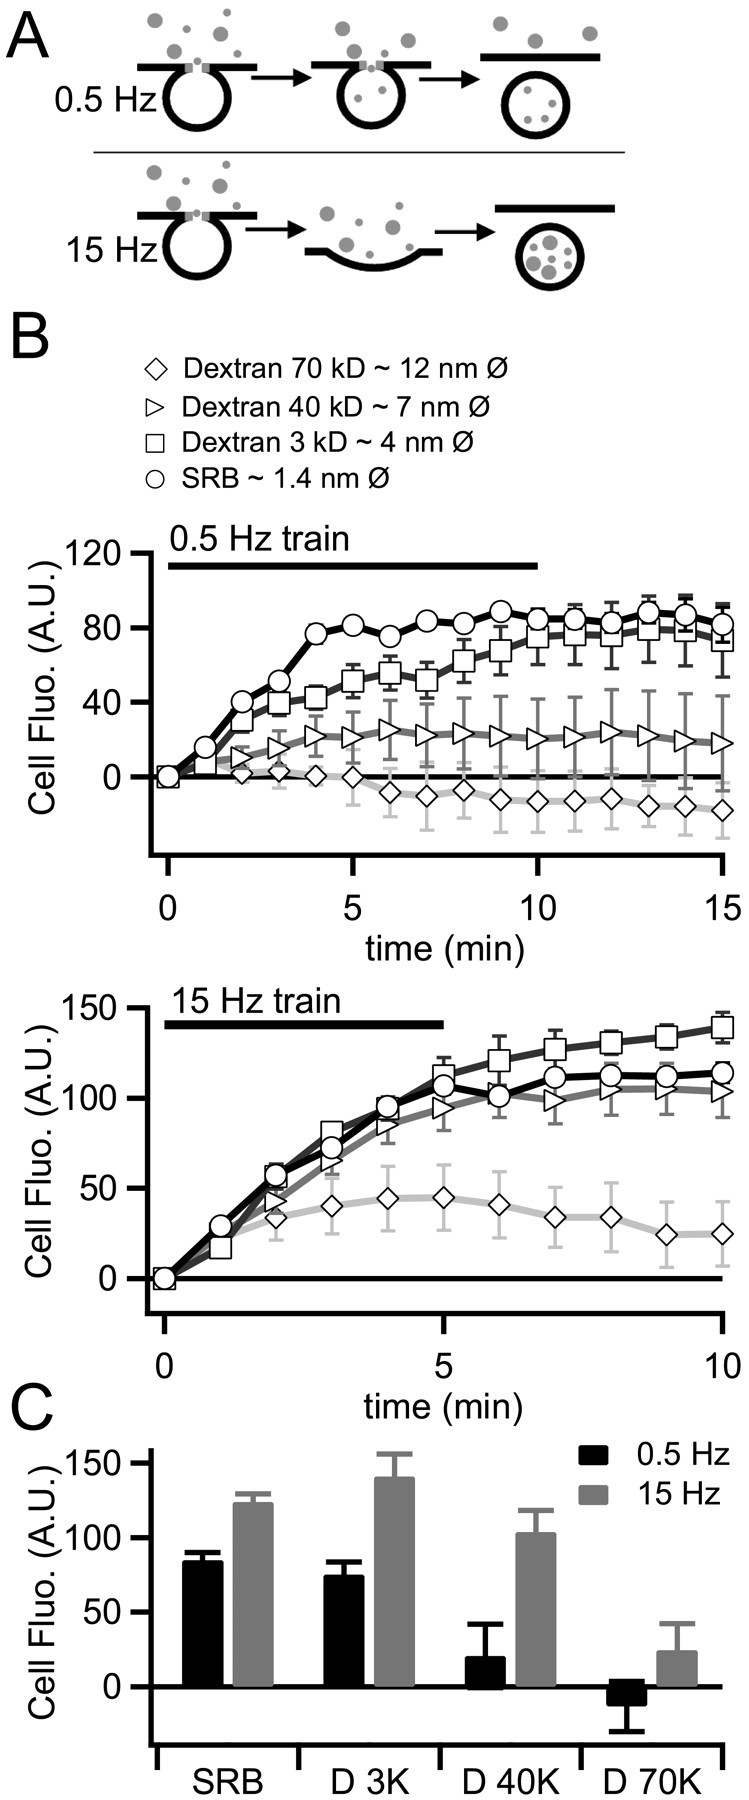
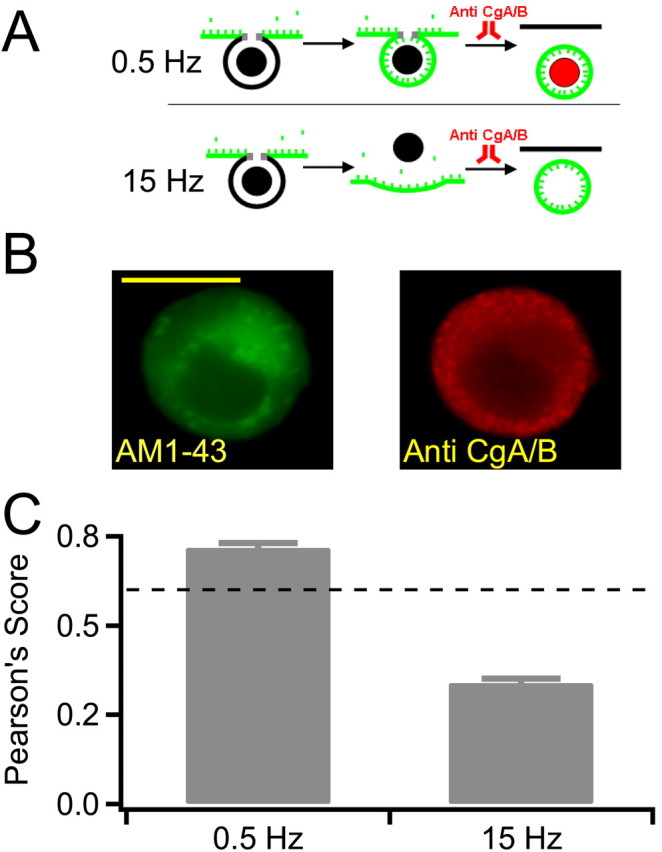
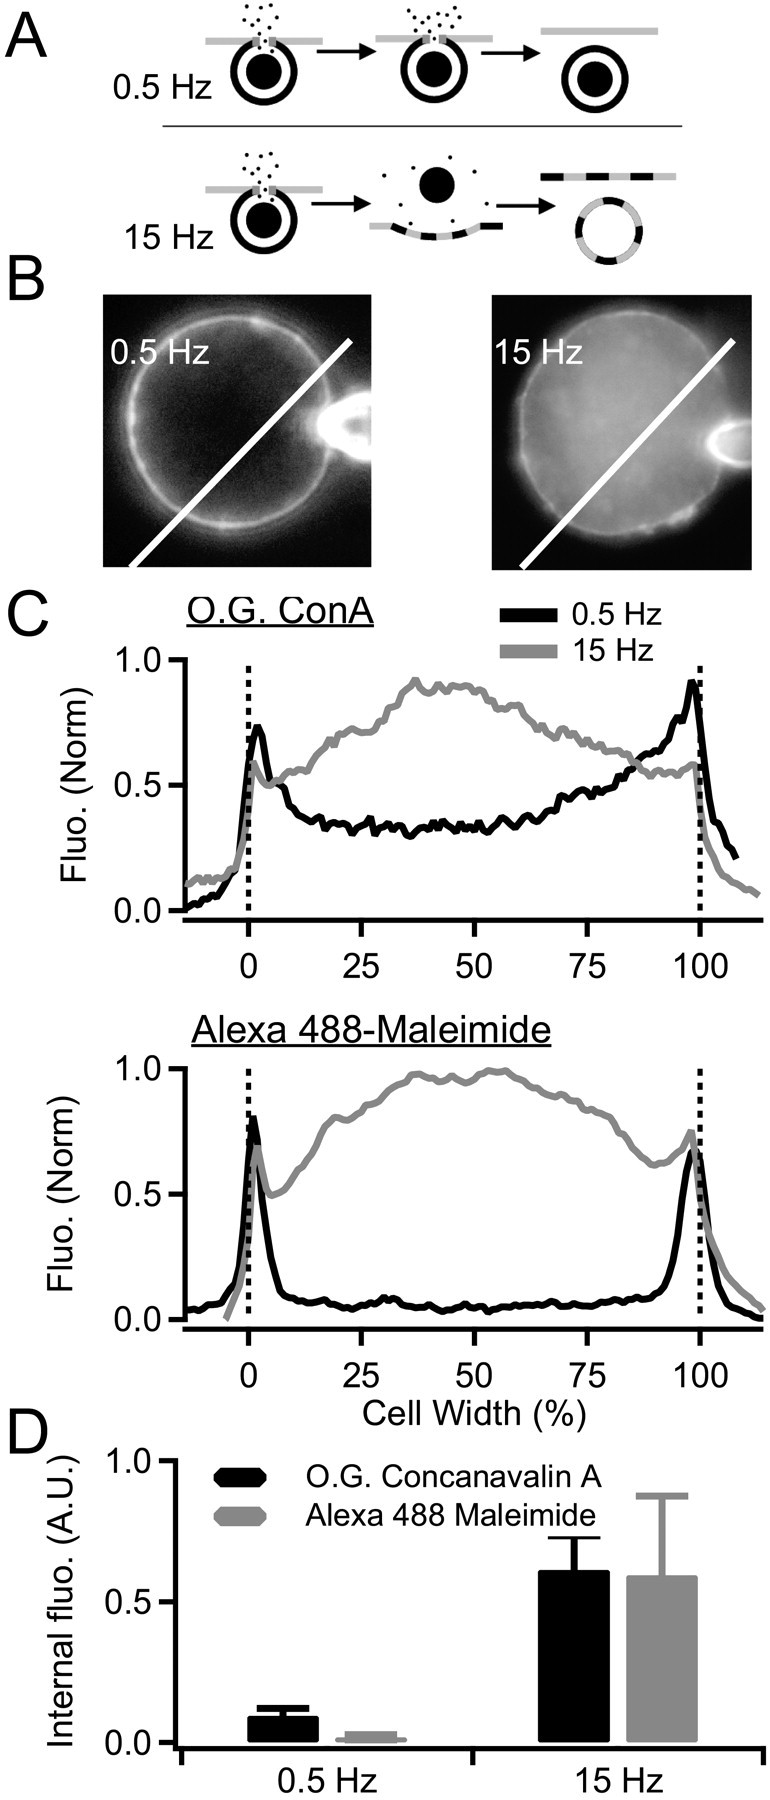
Chromaffin cells of the adrenal medulla are a primary neuroendocrine output of the sympathetic nervous system. When stimulated, they secrete a host of transmitter molecules, including catecholamines and neuropeptides, through the fusion of dense core secretory granules with the cell surface. At basal firing rates, set by the sympathetic tone, chromaffin cells selectively release catecholamines at a modest rate. Stress-mediated sympathetic activation leads to elevated catecholamine secretion and also evokes neuropeptide release. Catecholamines and neuropeptides are copackaged in the same granules; thus, it is unclear how this activity-dependent differential transmitter release is achieved. In this report, we use electrophysiological, electrochemical, fluorescence, and immunocytochemical approaches to quantify transmitter release under physiological electrical stimulation at the single cell level. We provide data to show that chromaffin cells selectively release catecholamine under basal firing conditions but release both neuropeptides and catecholamines under conditions that match acute stress. We further show that this differential transmitter release is achieved through a regulated activity-dependent dilation of the granule fusion pore. Thus, chromaffin cells may regulate release of different transmitters through a simple size-exclusion mechanism.


Figures

Figure 1.
Figure 1.
Amperometric spikes vary in size with cell activity. A, Carbon fiber amperometry was used to record catecholamine release. Stimulation at 0.5 Hz elicited spikes at a lower rate than stimulation at 15 Hz. For better visual comparison, both records are presented on the same 150 s time scale and do not represent the entire stimulation epoch. The boxed inset shows total integrated amperometric currents collected from 10 cells stimulated at 0.5 Hz and 11 cells stimulated at 15 Hz and confirms the release of approximately the same amount of catecholamine under each condition. B, As indicated in the raw records, mean spike amplitude and catecholamine charge integral was smaller in the 0.5 Hz condition than in the 15 Hz condition. C, Representative amperometric event from the 15 Hz conditions and the 0.5 Hz condition are shown. Stimulation at 0.5 Hz revealed some conventional spikes as observed under the 15 Hz condition; however, many smaller, longer-duration events were also observed. In addition, a number of flicker events were observed. Error bars represent SEM.
Figure 2.
Figure 2.
Endosomes exclude marker internalization in an activity and size-dependent manner. A, A diagram summarizing the experimental protocol is provided. Cells were stimulated with 0.5 and 15 Hz action potential waveforms. Fluid phase fluorescent markers of varying diameter were included in the bath solution. B, Cells were imaged during the stimulus trains and for 5 min after stimulation. To measure the kinetics of dye uptake, internalized fluorescence (Internal fluo.) was measured off-line on a per-frame basis for each fluorophore and each stimulus condition. B, The data from this protocol are plotted for each condition (0.5 Hz in the top plot and 15 Hz in the bottom plot). C, Total internalized fluorescence was quantified at for the entire stimulus period and is plotted for each condition. These data indicate that the pore between the granule lumen and extracellular space remains smaller under 0.5 Hz than under 15 Hz stimulation. A.U., Arbitrary units. Error bars represent SEM.
Figure 3.
Figure 3.
Endosomes retain neuropeptides under 0.5 Hz stimulation. A, A diagram summarizing the experimental protocol is provided. Cells were bathed in 10 μm AM1-43 (green markers) and stimulated at either 0.5 or 15 Hz. Internalized fluorescence represents recently retrieved endosomal membrane. Cells were fixed 10 min after stimulation and permeabilized. Chromogranins A and B were detected with a pan antibody and visualized with a rhodamine-conjugated secondary antibody. The cells were then washed and labeled with a rhodamine-tagged goat anti-rabbit IgG secondary antibody to visualize CgA/B. B, Sample images of positive control cells are provided. The calculated depth of field of the optical system used for this analysis is ∼115 nm; thus, optical sectioning in the z-axis is less than the diameter of a single secretory granule. Scale bar, 10 μm. C, A Pearson's cross-correlation analysis was performed on data collected from 0.5 and 15 Hz stimulated cells. A score >0.6 (dashed line) represents a high degree of cross-correlation. Thus, endosomes generated under 0.5 Hz stimulation retain their protein core, whereas those generated under 15 Hz are emptied. Error bars represent SEM.
Figure 4.
Figure 4.
Stimulation at 0.5 Hz selectively retrieves granule membrane. A, A diagram summarizing the experimental protocol is provided. Surface-cell membranes were irreversibly labeled with either O.G. ConA or Alexa 488-taged maleimide. Cells were then washed and stimulated at 0.5 or 15 Hz to evoke equivalent catecholamine release. Cells were imaged to track the fate of the prelabeled cell-surface membrane. B, Example images of cells labeled with O.G. ConA are provided. Dye internalization was determined by measuring fluorescence (Fluo.) along a line profile drawn through the cell. Scale bar, 5 μm. C, Example line profiles are provided for cells prelabeled with O.G. ConA (top plot) or Alexa 488-maleimide (bottom plot) and stimulated at 0.5 and 15 Hz. D, Internalized fluorescence was determined as the mean value in the interior 80% of the line profile (10-90% cell width). Average values collected from four cells in each condition are shown. From these data, it is concluded that 0.5 Hz stimulation results in specific retrieval of granule membrane, whereas 15 Hz stimulation evokes retrieval of mixed surface and granule membrane. Error bars represent SEM.
Figure 5.
Figure 5.
Endosomes generated under 0.5 Hz stimulation undergo rapid recycling. Ai, Local endosomal recycling was measured under 0.5 Hz stimulation by combined electrophysiological and fluorometry techniques. A chromaffin cell was bathed in a Ringer's containing 800 nm FM1-43 and stimulated at 0.5 Hz to label newly formed endosomes. The cell was then washed in dye-free Ringer's and allowed to rest for 250 s and then restimulated with a second train of action potential waveforms again at 0.5 Hz. FM1-43 staining and destaining was measured by a photomultiplier tube through a limited aperture opening set to collect light emitted from the cell surface and a representative portion of cytosol but not the brightly labeled patch-pipette contact point (box in inset). We attenuated the light intensity by passing it through a 5% transmission neutral-density filter to guard against photobleach and damage during the prolonged exposure used in this protocol. The activity-dependent decrease in fluorescence (Fluo.) during the second stimulus train indicates reuse of newly internalized endosomal membrane. Aii, Amperometry current measured during the same protocol used to generate A show that the release of newly internalized FM1-43 is accompanied by catecholamine release. B, The staining/destaining protocol presented in A was repeated on cells stimulated at 0.5 Hz (n = 6) and 15 Hz (n = 5). Dye rerelease was determined as fluorescence decrease during the second train normalized (Norm.) against dye uptake in the first train (0 = no dye rerelease; 1 = complete dye rerelease). Data pooled from all cells are presented in the category plot and consistent with a local and rapid endosomal path under 0.5 Hz stimulation but not under 15 Hz stimulation. C, Internalized fluorescence traces endosomal trafficking. To determine the destination of endosomes we measured the internalized FM1-43 signal along line profiles drawn through cells after stimulation (as in Fig. 4C). Representative profiles obtained after stimulation by 0.5 Hz, 15 Hz, or unstimulated control cells are plotted. Profiles shown are ΔF/F0, where F0 represents prestimulus FM1-43 staining. These data show that endosomes generated under 0.5 Hz stimulation remain near the periphery of the cell, whereas those generated under 15 Hz stimulation traffic to the center of the cell. A.U., Arbitrary units; Wash, washout; sAP, simulated action potential. Error bars represent SEM.
Figure 6.
Figure 6.
A proposed mechanism for activity-dependent differential transmitter release in adrenal chromaffin cells. Stim., Stimulation.

Similar articles

Cited by

References

    1. Albillos A, Dernick G, Horstmann H, Almers W, Alvarez de Toledo G, Lindau M (1997) The exocytotic event in chromaffin cells revealed by patch amperometry. Nature 389: 509-512. - PubMed
    1. Alvarez de Toledo G, Fernández-Chacón R, Fernández JM (1993) Release of secretory products during transient vesicle fusion. Nature 363: 554-558. - PubMed
    1. Angleson JK, Cochilla AJ, Kilic G, Nussinovitch I, Betz WJ (1999) Regulation of dense core release from neuroendocrine cells revealed by imaging single exocytotic events. Nat Neurosci 2: 440-446. - PubMed
    1. Aravanis AM, Pyle JL, Tsien RW (2003) Single synaptic vesicles fusing transiently and successively without loss of identity. Nature 423: 643-647. - PubMed
    1. Artalejo CR, Elhamdani A, Palfrey HC (2002) Sustained stimulation shifts the mechanism of endocytosis from dynamin-1-dependent rapid endocytosis to clathrin- and dynamin-2-mediated slow endocytosis in chromaffin cells. Proc Natl Acad Sci USA 99: 6358-6363. - PMC - PubMed

Publication types

MeSH terms