. 2005 Aug 10;25(32):7429-37.
doi: 10.1523/JNEUROSCI.2314-05.2005.

Prefrontal control of the amygdala

Affiliations

Prefrontal control of the amygdala

Ekaterina Likhtik et al. J Neurosci. .

Abstract

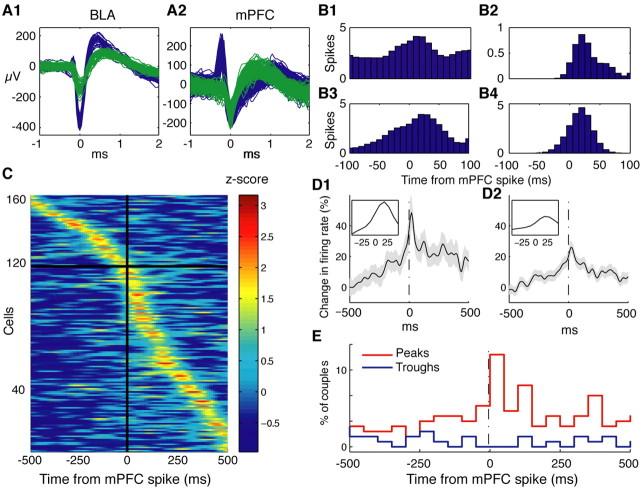
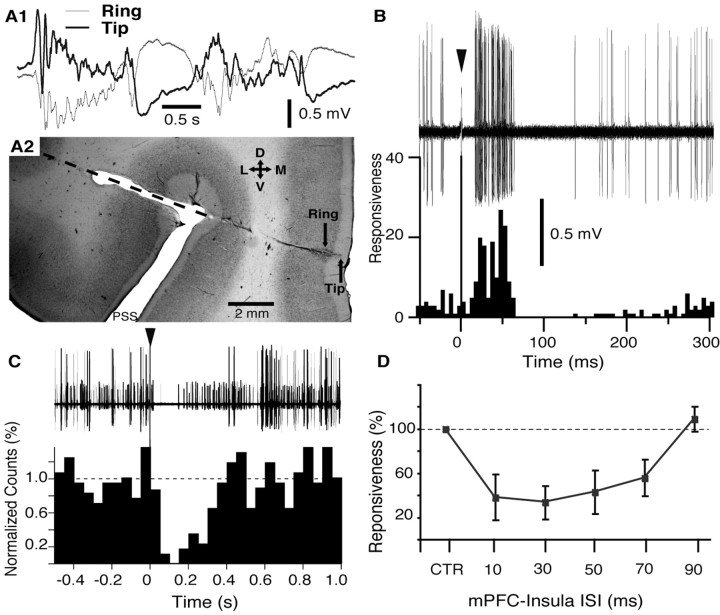
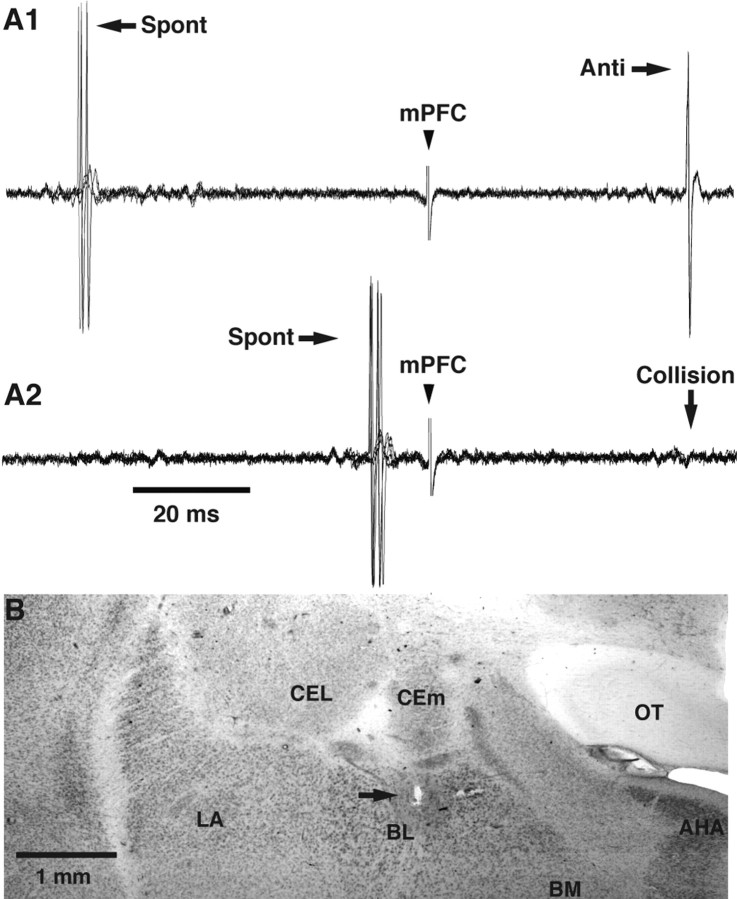
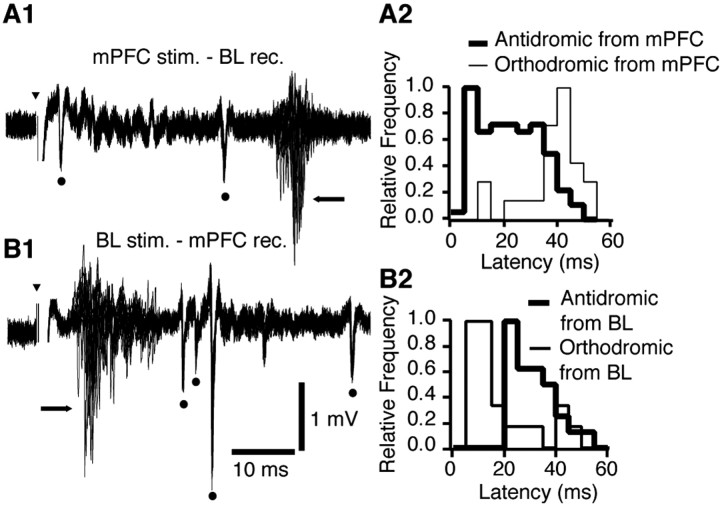
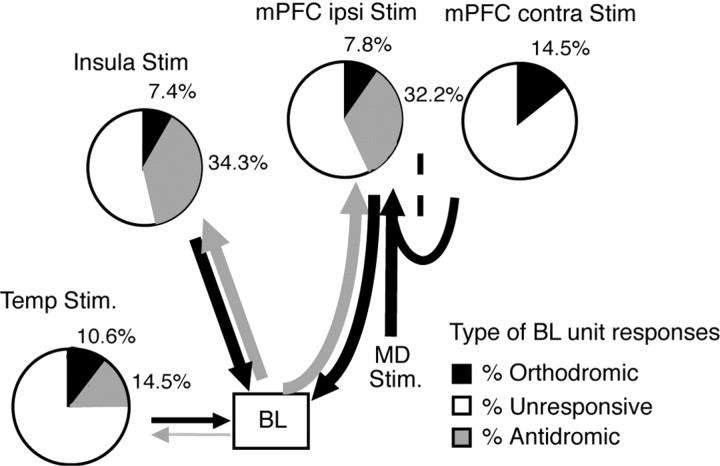
Accumulating evidence indicates that phobic and posttraumatic anxiety disorders likely result from a failure to extinguish fear memories. Extinction normally depends on a new learning that competes with the original fear memory and is driven by medial prefrontal cortex (mPFC) projections to the amygdala. Although mPFC stimulation was reported to inhibit the central medial (CEm) amygdala neurons that mediate fear responses via their brainstem and hypothalamic projections, it is unclear how this inhibition is generated. Because the mPFC has very sparse projections to CEm output neurons, the mPFC-evoked inhibition of the CEm is likely indirect. Thus, this study tested whether it resulted from a feedforward inhibition of basolateral amygdala (BLA) neurons that normally relay sensory inputs to the CEm. However, our results indicate that mPFC inputs excite rather than inhibit BLA neurons, implying that the inhibition of CEm cells is mediated by an active gating mechanism downstream of the BLA.


Figures

Figure 1.
Figure 1.
Spontaneous mPFC firing is associated with an increased firing probability in BL neurons. The activity of simultaneously recorded BLA and mPFC neurons was cross-correlated using mPFC cells as references. A1, A2, Waveforms of all spikes from different cells (blue and green traces) recorded by an electrode located in the BLA (A1) and an electrode located in the mPFC (A2). Cells were isolated off-line using a clustering algorithm. B1-B4, Examples of individual CCs obtained in different animals. These CCs peaked at ∼20-50 ms after the mPFC reference spike. C, Graph depicting all statistically significant mPFC-BL CCs, sorted by their peak time. Bins of 10 ms are expressed in z-scores and presented in pseudocolor. To test for significance, we compared each bin in the ± 500 ms range to a Poisson distribution with mean (λ) calculated from a baseline period (-1000 to -750 ms). The p value was Bonferroni-corrected for multiple bin comparisons, accounting for -500 ms in 10 ms bins (i.e., 0.05/100). D1, D2, Average of all significant mPFC-BL CCs (D1) and of all available CCs (D2). The shaded area shows ±SEM. Insets show expanded view of the histogram peaks. Note peak at ∼30 ms. E, Frequency distribution of the position of CC peaks (red) and troughs (blue) for the data shown in C (bins of 50 ms). All depicted CCs were smoothed with a Gaussian kernel of 10 ms.
Figure 2.
Figure 2.
Effect of electrical mPFC stimulation on neuronal activity in the BL nucleus. A1, A2, Electrophysiological criteria used to adjust the position of a concentric stimulating electrode in superficial mPFC layers. A1, Electrode position was adjusted such that the EEG activity recorded by the tip (thick line) and ring (thin line) of the electrode (0.7 mm spacing) was of opposite polarity. In this position, the tip of the electrode was usually located in layer I. A2, Coronal section of the mPFC stained with neutral red showing trajectory of the electrode aimed to the mPFC. Orientation of the section is indicated by the cross where D, V, L, and M stand for dorsal, ventral, lateral, and medial, respectively. B, Example of BL neuron orthodromically activated by mPFC stimulation (arrowhead indicates mPFC stimulation artifact). Forty superimposed sweeps are shown on top; a poststimulus histogram (5 ms bins) based on 100 such sweeps is shown below using the same time base. Responsiveness was defined as the number of spikes divided by the number of stimuli. C, mPFC stimulation (arrowhead) evokes suppression of spontaneous firing in a group of BL neurons recorded simultaneously by the same electrode. Forty superimposed sweeps are shown at the top; a poststimulus histogram (50 ms bins) based on 54 such sweeps is shown below using the same time base. The dashed line indicates average bin value in the prestimulus period (normalized to 1). D, mPFC stimulation inhibits the orthodromic responsiveness of BL neurons to insular inputs. Graph plots average orthodromic responsiveness (y-axis) of seven neurons to insula stimuli applied alone (CTR, control) or preceded by mPFC stimuli with various ISIs (x-axis). Data were obtained in four different animals. PSS, Presylvian sulcus. Error bars indicate SE.
Figure 3.
Figure 3.
Physiological and histological identification of BL recording sites. A1, A2, Collision test used to determine whether an evoked spike was elicited by antidromic invasion. A1, mPFC stimuli evoke antidromic spikes (Anti) at a fixed latency (three superimposed sweeps). A2, Spontaneous spikes (Spont) occurring within the collision interval abolish (Collision) the antidromic response. Collision does not occur when the interval between the spontaneous and antidromic spikes is outside the collision interval as in A1. B, Coronal section of the amygdala stained with neutral red. The arrow points to an electrolytic lesion that marks the position of the first BL neuron antidromically responsive to mPFC stimuli encountered during the electrode track. This point coincides with the dorsal border of the BL nucleus, as predicted from tract-tracing studies. AHA, Amygdalohippocampal area; BM, basomedial nucleus; CEL, central lateral nucleus; LA, lateral nucleus; OT, optic tract.
Figure 4.
Figure 4.
The axons of BL neurons projecting to the mPFC have a shorter conduction time than mPFC axons ending in the BL nucleus. A1, Example of multiunit responses elicited by mPFC stimuli in the BL nucleus (20 superimposed sweeps). A2, Distribution of antidromic (thick lines) and orthodromic (thin lines) response latencies (all experiments combined). Each distribution was normalized to its mode. Antidromic response latencies ranged widely from 4 to 46 ms, with a mode of 8 ms. B1, Example of responses elicited by BL stimuli in the mPFC (20 superimposed sweeps). B2, Distribution of antidromic (thick lines) and orthodromic (thin lines) response latencies (all experiments combined). Antidromic response latencies ranged from 21 to 47 ms, with a mode of 24 ms. Dots and arrows mark antidromic and orthodromic responses, respectively. Bins of 5 ms in A2 and B2. Arrowheads indicate stimulation artifacts.
Figure 5.
Figure 5.
Depending on the strength and directionality of connections, electrical stimulation of different cortical areas elicits contrasting patterns of BL unit responsiveness. Pie charts show relative incidence of orthodromically responsive (black), antidromically responsive (gray), and unresponsive BL cells with various stimulation sites (area temp, bottom left; insula, top left; ipsilateral mPFC, center; indirect activation of the mPFC, top right). Thickness of arrows indicates relative strength of connections between stimulation sites and BL nucleus, as described in previous tract-tracing studies (see references in Results). Temp, Temporal neocortex; Stim, stimulation; ipsi, ipsilateral; contra, contralateral.
Figure 6.
Figure 6.
Lidocaine infusion in the mPFC blocks an orthodromic response of a BL projection cell evoked by MD stimulation. A BL neuron that was antidromically responsive to mPFC stimuli (A1, dot) and synaptically activated by MD (B1) and area temp (C1) stimulation is shown. Lidocaine infusion in the mPFC reduced MD-evoked field potentials in the mPFC (A2) and orthodromic spiking of the tested BL neuron (B2). In contrast, orthodromic responsiveness of the tested cell to stimulation of area temp was unchanged after lidocaine infusion in the mPFC (C2). Note that, in B2, the response of the test neuron was abolished, although the stimulus duration and intensity were increased from B1. The MD-evoked field potential in A2 was recorded bipolarly (ring - tip) to ensure that the evoked potential was generated locally. Poststimulus histograms in B1 and B2 were constructed from responses to 50 MD stimuli. Insets show 20 superimposed sweeps. Poststimulus histograms in C1 and C2 were constructed from responses to 40 area temp stimuli. Fifteen superimposed sweeps are depicted. In B1, B2, C1, and C2, we depict only sweeps devoid of spontaneous firing in the 100 ms preceding the stimuli. Arrowheads indicate stimulation artifacts.

References

    1. Bechara A, Tranel D, Damasio H, Adolphs R, Rockland C, Damasio AR (1995) Double dissociation of conditioning and declarative knowledge relative to the amygdala and hippocampus in humans. Science 269: 1115-1118. - PubMed
    1. Berretta S, Pantazopoulos P, Pantazopoulos H, Paré D (2005) Infralimbic cortex activation increases c-Fos expression in intercalated neurons of the amygdala. Neuroscience 132: 943-953. - PMC - PubMed
    1. Boehnke SE, Rasmusson DD (2001) Time course and effective spread of lidocaine and tetrodotoxin delivered via microdialysis: an electrophysiological study in cerebral cortex. J Neurosci Methods 105: 133-141. - PubMed
    1. Bremner JD, Staib LH, Kaloupek D, Southwick SM, Soufer R, Charney DS (1999) Neural correlates of exposure to traumatic pictures and sound in Vietnam combat veterans with and without posttraumatic stress disorder: a positron emission tomography study. Biol Psychiatry 45: 806-816. - PMC - PubMed
    1. Brinley-Reed M, Mascagni F, McDonald AJ (1995) Synaptology of prefrontal projections to the basolateral amygdala: an electron microscopic study in the rat. Neurosci Lett 202: 45-48. - PubMed

Publication types

MeSH terms

LinkOut - more resources