

Assessment of PACS display systems
- PMID: 16094505
- PMCID: PMC3046721
- DOI: 10.1007/s10278-005-6974-7
Assessment of PACS display systems
Abstract
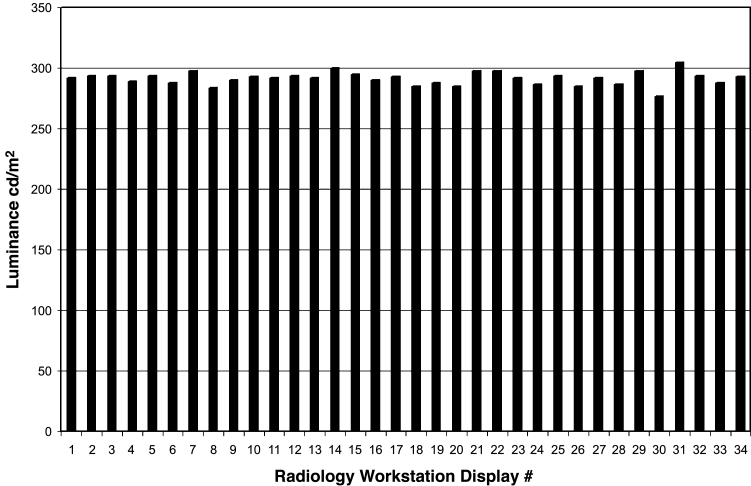
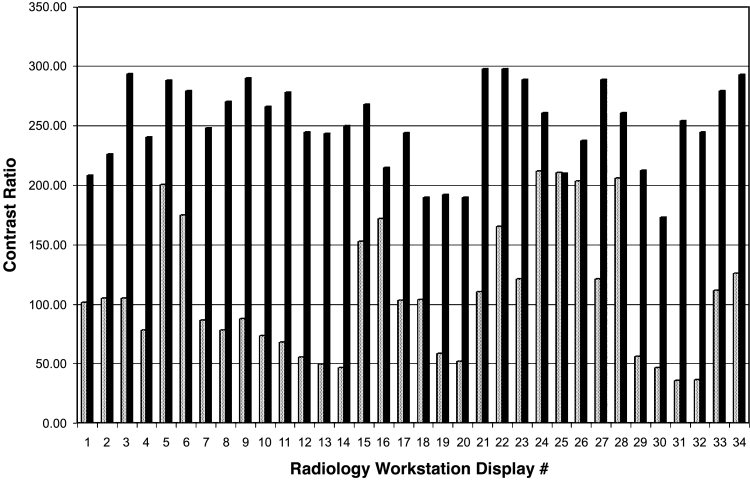
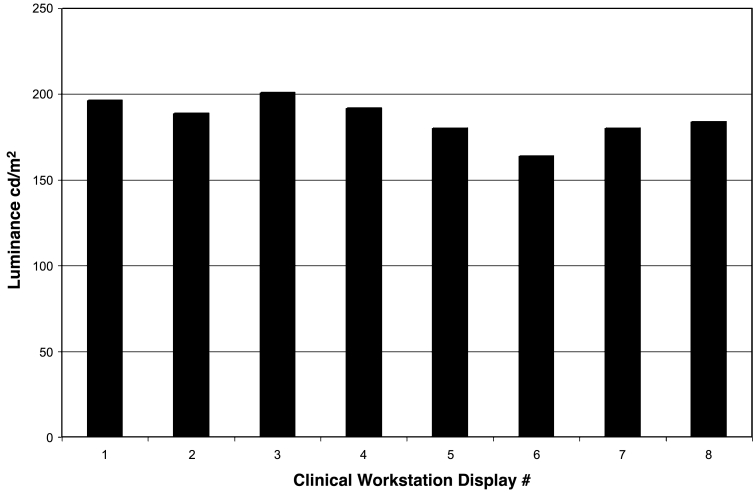
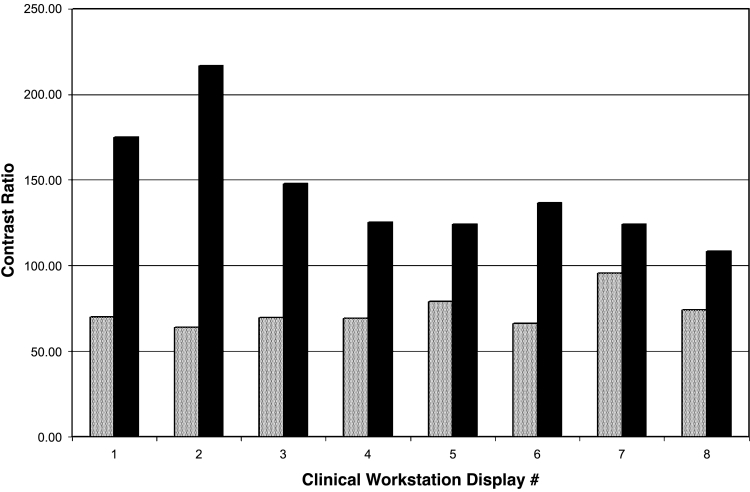
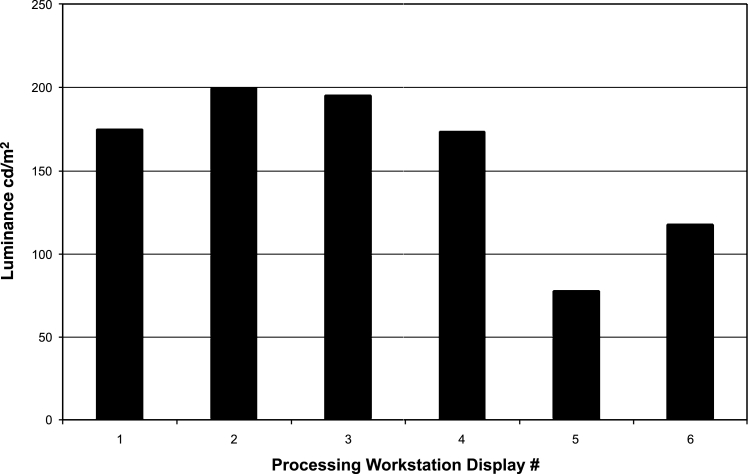
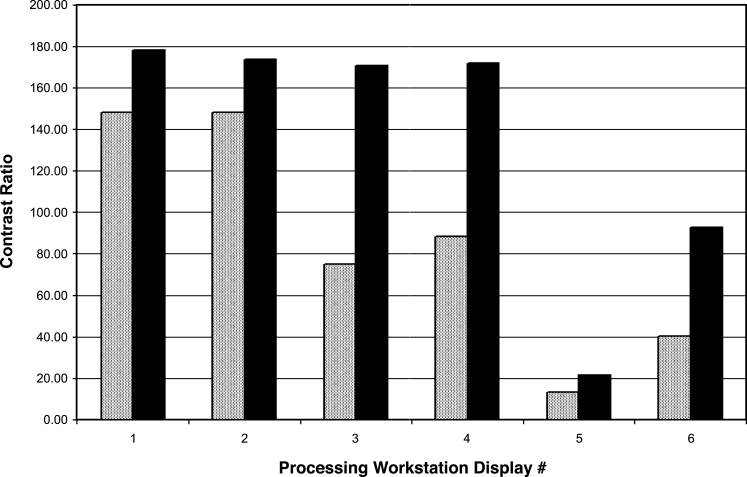
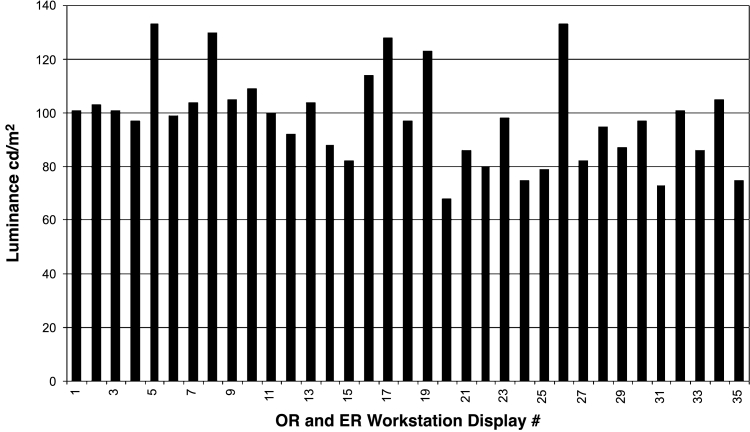
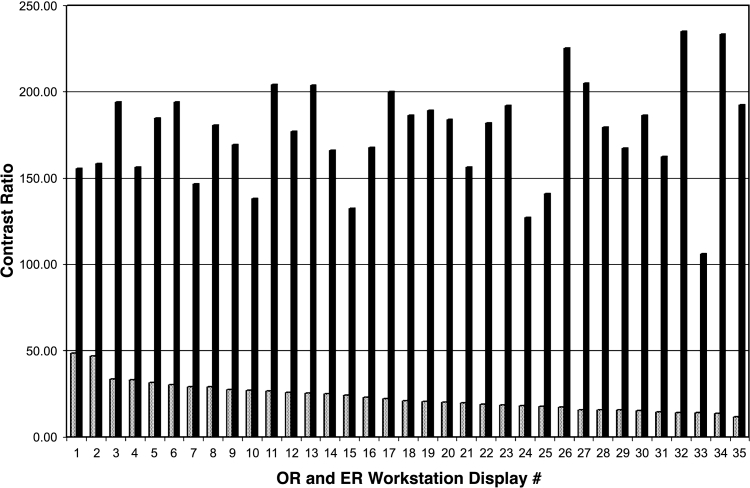
This work describes our experience in reviewing the performance criteria for display systems and how we have implemented a practical approach to the assessment of the workstation environment in a large tertiary care hospital. The acceptance criteria contained in the draft report of Topic Group 18 of the American Association of Physicists in Medicine (AAPM) were used as a basis for assessment of primary and secondary displays. A telescopic photometer was used to measure the maximum luminance and the contrast ratio of the image for the displays used in our radiology department and in the operating and emergency rooms using the standard Society of Motion Picture and Television Engineers (SMPTE) pattern, in ambient light and with light decreased as much as possible. About half of the displays met the AAPM criteria for minimum luminance and contrast ratio in low light. None of the systems met the contrast ratio criteria in ambient light. The challenges in improving the performance and calibrating displays are discussed.
Figures
Similar articles
-
SoftCopy Display Quality Assurance Program at Texas Children's Hospital.J Digit Imaging. 2002;15 Suppl 1:33-40. doi: 10.1007/s10278-002-5027-8. Epub 2002 Mar 21. J Digit Imaging. 2002. PMID: 12105695
-
Practical assessment of the display performance of radiology workstations.Br J Radiol. 2007 Apr;80(952):256-60. doi: 10.1259/bjr/82769410. Epub 2006 Oct 12. Br J Radiol. 2007. PMID: 17038407
-
Optimization of reading conditions for flat panel displays.J Digit Imaging. 2006 Jun;19(2):181-7. doi: 10.1007/s10278-006-9710-z. J Digit Imaging. 2006. PMID: 16437286 Free PMC article.
-
A brief review of human perception factors in digital displays for picture archiving and communications systems.J Digit Imaging. 1997 Nov;10(4):158-68. doi: 10.1007/BF03168838. J Digit Imaging. 1997. PMID: 9399169 Free PMC article. Review.
-
AAPM/RSNA tutorial on equipment selection: PACS equipment overview: display systems.Radiographics. 2004 May-Jun;24(3):879-89. doi: 10.1148/rg.243035133. Radiographics. 2004. PMID: 15143237 Review.
Cited by
-
Transition to computed radiography: can emergency medicine doctors accurately predict the need of film printing to facilitate optimal patient care?World J Emerg Med. 2011;2(1):33-7. World J Emerg Med. 2011. PMID: 25214980 Free PMC article.
-
Soft-copy display and reading: what the radiologist should know in the digital era.Pediatr Radiol. 2008 Dec;38(12):1276-84. doi: 10.1007/s00247-008-0898-6. Epub 2008 Jun 12. Pediatr Radiol. 2008. PMID: 18548242 Review.
-
Comparison of the commercial color LCD and the medical monochrome LCD using randomized object test patterns.PLoS One. 2012;7(5):e37769. doi: 10.1371/journal.pone.0037769. Epub 2012 May 31. PLoS One. 2012. PMID: 22701534 Free PMC article. Clinical Trial.
-
Medical imaging informatics: how it improves radiology practice today.J Digit Imaging. 2007 Jun;20(2):99-104. doi: 10.1007/s10278-007-9010-2. Epub 2007 Feb 16. J Digit Imaging. 2007. PMID: 17505868 Free PMC article. No abstract available.
References
MeSH terms
LinkOut - more resources
Full Text Sources
Miscellaneous
