. 2005 Oct 15;568(Pt 2):381-96.
doi: 10.1113/jphysiol.2005.092866. Epub 2005 Aug 11.

Role of aspartate 298 in mouse 5-HT3A receptor gating and modulation by extracellular Ca2+

Affiliations

Role of aspartate 298 in mouse 5-HT3A receptor gating and modulation by extracellular Ca2+

Xiang-Qun Hu et al. J Physiol. .

Abstract

The TM2-TM3 extracellular loop is critical for activation of the Cys-loop family of ligand-gated ion channels. The contribution of aspartate 298 (D298), an amino acid that links the transmembrane domain 2 (TM2) to the TM2-TM3 loop, in mouse 5-hydroxytryptamine(3A) (5-HT(3A)) receptor function was probed with site-directed mutagenesis in the present study. This negatively charged residue was replaced with an alanine to neutralize the charge, with a glutamate to conserve the charge, or with an arginine to reverse the charge. Human embryonic kidney 293 (HEK 293) cells transfected with the wild-type and mutant receptors were studied by combining whole-cell patch-clamp recording with fast agonist application. The D-->A or D-->R mutations resulted in a receptor with reduced 5-HT potency, and accelerated kinetics of desensitization and deactivation. In addition, the efficacy of partial agonists was reduced by the D-->A mutation. The D-->E mutation produced a receptor with properties similar to those of the wild-type receptor. In addition, the potential role of this residue in modulation of the receptor by extracellular calcium ([Ca(2)(+)](o)) was investigated. Increasing [Ca(2)(+)](o) inhibited 5-HT-activated currents and altered receptor kinetics in a similar manner in the wild-type and D298E receptors, and this alteration was eliminated by the D-->A and D-->R mutations. Our data suggest that the charge at D298 participates in transitions between functional states of the 5-HT(3A) receptor, and provide evidence that the charge of the side-chain at residue D298 contributes to channel gating kinetics and is crucial for Ca(2)(+) modulation.


Figures

Figure 1
Figure 1. Position of D298 and effects of the D298 mutations on 5-HT concentration–response and I–V relationships
A, putative topology of the 5-HT3A receptor. The arrow indicates the position of D298. B, sequence alignment of the TM2–TM3 loop from the Cys-loop ligand-gated ion channels. Arrow indicates the site of mutations. C, traces show current activated by 30 μm 5-HT from individual HEK 293 cells expressing the wild-type (WT) and mutant receptors. Arrows indicate the application of agonist. D, concentration–response curves of 5-HT-activated currents for the WT and mutant receptors. Data were normalized to peak current activated by 30 μm 5-HT for each cell. Each data point represents mean ±s.e.m. from 5 to 23 cells. Note the overlapping of curves for the WT and D298E receptors. E, voltage ramps obtained at the peak of current activated by 3 μm 5-HT. Currents activated by the voltage protocol in the absence of 5-HT have been subtracted. Data are normalized to the current amplitude obtained at −80 mV. Similar results were obtained from 5 to 7 cells.
Figure 2
Figure 2. D298 mutations alter 5-HT3A receptor activation kinetics
A, traces show receptor activation elicited by 3 μm (upper) and 30 μm (lower) 5-HT. The responses were normalized to peak current for comparison. The bar indicates the time of agonist application. B, plot of the activation rate (1/τact) versus 5-HT concentration. Each data point represents mean ±s.e.m. from 8 to 55 cells.
Figure 3
Figure 3. D298 mutations alter desensitization and deactivation of 5-HT-activated current
A, traces show desensitization of 30 μm 5-HT-activated current. The bar indicates the time of agonist application. B, traces show deactivation after termination of 2 ms application of 1 mm 5-HT. The arrow indicates the brief application of 5-HT. Currents were normalized to peak current and superimposed for comparison of desensitization and deactivation. Time constants for desensitization and deactivation were estimated by fitting with either a mono-exponential (WT, D298E and D298R) or a bi-exponential (D298A) function. Examples of exponential fits are presented in the boxed insets in grey. Data are summarized in Table 1.
Figure 4
Figure 4. D298 mutations alter the relative efficacy of partial agonists
Traces show currents activated by partial agonists, 2-Me-5-HT (A) and dopamine (DA, B). The cells expressing the WT and mutant receptors were first exposed to 30 μm 5-HT. After complete washout of the agonist, the cells were challenged with either 100 μm 2-Me-5-HT or 3 mm DA. The relative efficacy of the partial agonists was determined by normalizing the current amplitude activated by partial agonists as a percentage of that activated by 30 μm 5-HT.
Figure 5
Figure 5. Alterations of kinetics of partial agonist-activated currents by the D298 mutations
Traces show kinetics of currents activated by partial agonists, 2-Me-5-HT (100 μm) and dopamine (3 mm). A, activation elicited by 2-Me-5-HT (upper) and DA (lower). B, desensitization of currents activated by 2-Me-5-HT for 15 s (upper) and 3 mm DA for 20 s (lower). C, deactivation of currents activated by 2-Me-5-HT (upper) and DA for 10 ms (lower). The bar indicates the time of agonist application for activation and desensitization studies, and the straight arrow indicates the time point of application of agonists for 10 ms for deactivation study. Data are summarized in Table 2.
Figure 6
Figure 6. Modulation of 5-HT-activated currents and I–V relationships by increasing [Ca2+]o in the WT and mutant receptors
A, traces show currents activated by 3 μm (upper) and 30 μm 5-HT (lower) in 1.8 and 10 mm [Ca2+]o. Cells expressing the WT and mutant receptors were first exposed to 5-HT in 1.8 mm [Ca2+]o followed by complete washout of the agonist. Cells were then incubated in 10 mm [Ca2+]o and exposed to the same concentration of agonist again. Note that the traces for the D298A and D298R receptors have faster time scale and the traces in 1.8 and 10 mm [Ca2+]o are almost completely superimposed. B, averaged data show effects of increasing [Ca2+]o on currents activated by 3 μm (upper) and 30 μm (lower) 5-HT. The current amplitude in 10 mm [Ca2+]o was normalized to that in 1.8 mm [Ca2+]o. Each bar represents mean ±s.e.m. from 5 to 20 cells. C, voltage ramp obtained at the peak of current activated by 3 μm 5-HT first in 1.8 mm [Ca2+]o then in 10 mm [Ca2+]o. Currents activated by the voltage protocol in the absence of 5-HT have been subtracted. D, averaged data show the reversal potentials (Erev) of 5-HT-activated currents. Each bar represents mean ±s.e.m. from 5 to 7 cells. **P < 0.01. The traces obtained in 1.8 mm [Ca2+]o are in black, whereas those obtained in 10 mm [Ca2+]o are in grey.
Figure 7
Figure 7. Effects of increasing [Ca2+]o on the kinetics of 5-HT-activated currents in the WT and mutant receptors
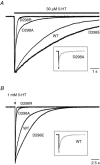
A, traces show alteration in activation, desensitization and deactivation by increasing [Ca2+]o from 1.8 to 10 mm (upper, receptor activation elicited by 1 mm 5-HT; middle, desensitization of 30 μm 5-HT-activated current; lower, deactivation after termination of 2 ms application of 1 mm 5-HT). Currents were normalized to peak current and superimposed for comparison. The bar indicates the time of agonist application, and the arrow indicates the time point of application of agonist for 2 ms. Note the overlapping of the desensitization traces for the D298A and D298R receptors in 1.8 and 10 mm [Ca2+]o. Also note that the deactivation traces for the D298A and D298R receptors have faster time scale and the traces in 1.8 and 10 mm [Ca2+]o are almost completely superimposed. B, averaged data show the alteration in activation (upper), desensitization (middle) and deactivation (lower). Each bar represents mean ±s.e.m. from 7 to 14 cells. **P < 0.01. The traces obtained in 1.8 mm [Ca2+]o are in black, whereas those obtained in 10 mm [Ca2+]o are in grey.
Figure 8
Figure 8. Effects of lowering [Ca2+]o on the amplitude and kinetics of 5-HT-activated currents in the WT and mutant receptors
A, traces show currents activated by 3 μm 5-HT in 1.8 and 0.1 mm [Ca2+]o. The cells expressing the WT and mutant receptors were first exposed to 5-HT in 1.8 mm [Ca2+]o followed by complete washout of the agonist. The cells were then incubated in 0.1 mm [Ca2+]o and exposed to the same concentration of agonist again. Note that the traces for the D298A receptor have faster time scale and the traces in 1.8 and 0.1 mm [Ca2+]o are almost completely superimposed. B, averaged data show effects of lowering [Ca2+]o on current activated by 3 μm 5-HT-activated currents. The current amplitude in 0.1 mm [Ca2+]o was normalized to that in 1.8 mm [Ca2+]o. Each bar represents mean ±s.e.m. from 9 to 17 cells. C, traces show alteration in desensitization and deactivation by lowering [Ca2+]o from 1.8 to 0.1 mm (upper, desensitization of 30 μm 5-HT-activated current; lower, deactivation after termination of 2 ms application of 1 mm 5-HT). Currents were normalized to peak current and superimposed for comparison. The bar indicates the time of agonist application, and the arrow indicates the time point of application of agonist for 2 ms. Note that the deactivation traces for the D298A receptor have faster time scale and the traces in 1.8 and 0.1 mm [Ca2+]o are almost completely superimposed. D, averaged data show the alteration in desensitization (upper) and deactivation (lower). Each bar represents mean ±s.e.m. from 6 to 8 cells. **P < 0.01. The traces obtained in 1.8 mm [Ca2+]o are in black, whereas those obtained in 0.1 mm [Ca2+]o are in grey.

Similar articles

Cited by

References

    1. Absalom NL, Lewis TM, Kaplan W, Pierce KD, Schofield PR. Role of charged residues in coupling ligand binding and channel activation in the extracellular domain of the glycine receptor. J Biol Chem. 2003;278:50151–50157. - PubMed
    1. Auerbach A, Akk G. Desensitization of mouse nicotinic acetylcholine receptor channels. A two-gate mechanism. J General Physiol. 1998;112:181–197. - PMC - PubMed
    1. Bera AK, Chatav M, Akabas MH. GABAA receptor M2–M3 loop secondary structure and changes in accessibility during channel gating. J Biol Chem. 2002;277:43002–43010. - PubMed
    1. Bianchi MT, Macdonald RL. Agonist trapping by GABAA receptor channels. J Neurosci. 2001;21:9083–9091. - PMC - PubMed
    1. Bouzat C, Gumilar F, Spitzmaul G, Wang HL, Rayes D, Hansen SB, Taylor P, Sine SM. Coupling of agonist binding to channel gating in an ACh-binding protein linked to an ion channel. Nature. 2004;430:896–900. - PubMed

Publication types

MeSH terms

LinkOut - more resources