. 2005 Aug;8(2):119-30.
doi: 10.1016/j.ccr.2005.07.004.

Early inactivation of p53 tumor suppressor gene cooperating with NF1 loss induces malignant astrocytoma

Affiliations

Early inactivation of p53 tumor suppressor gene cooperating with NF1 loss induces malignant astrocytoma

Yuan Zhu et al. Cancer Cell. 2005 Aug.

Abstract

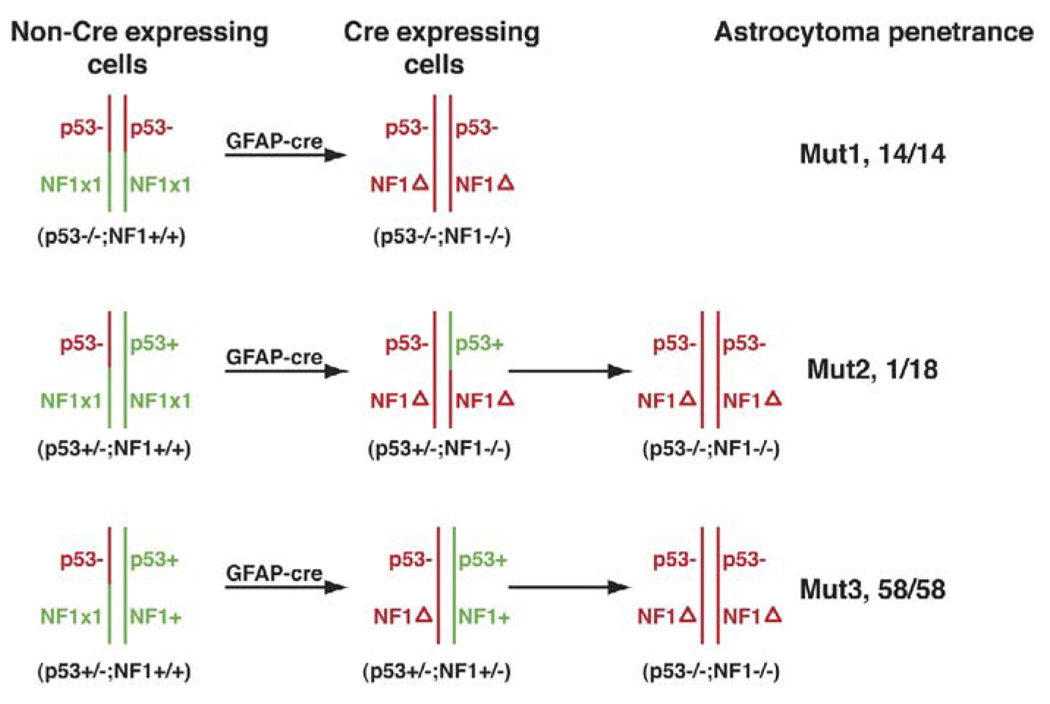
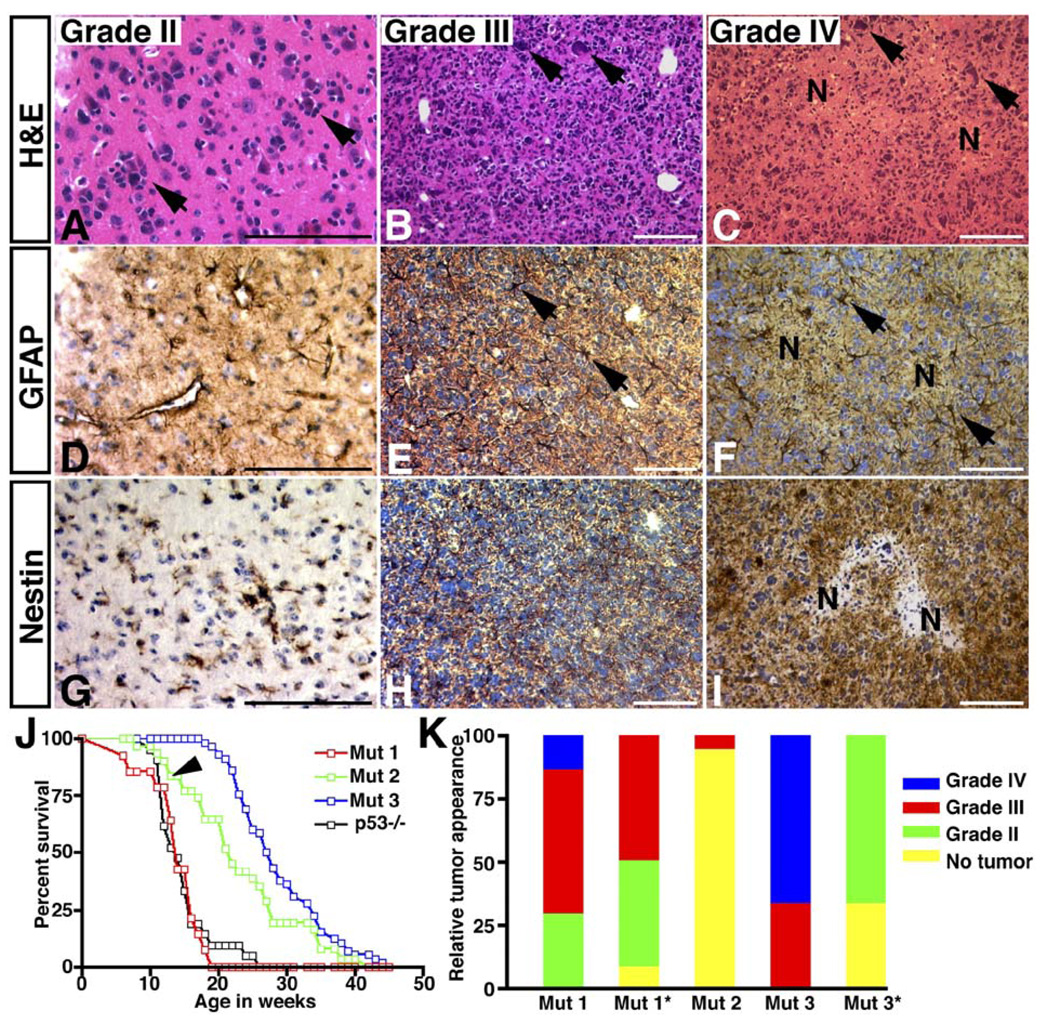
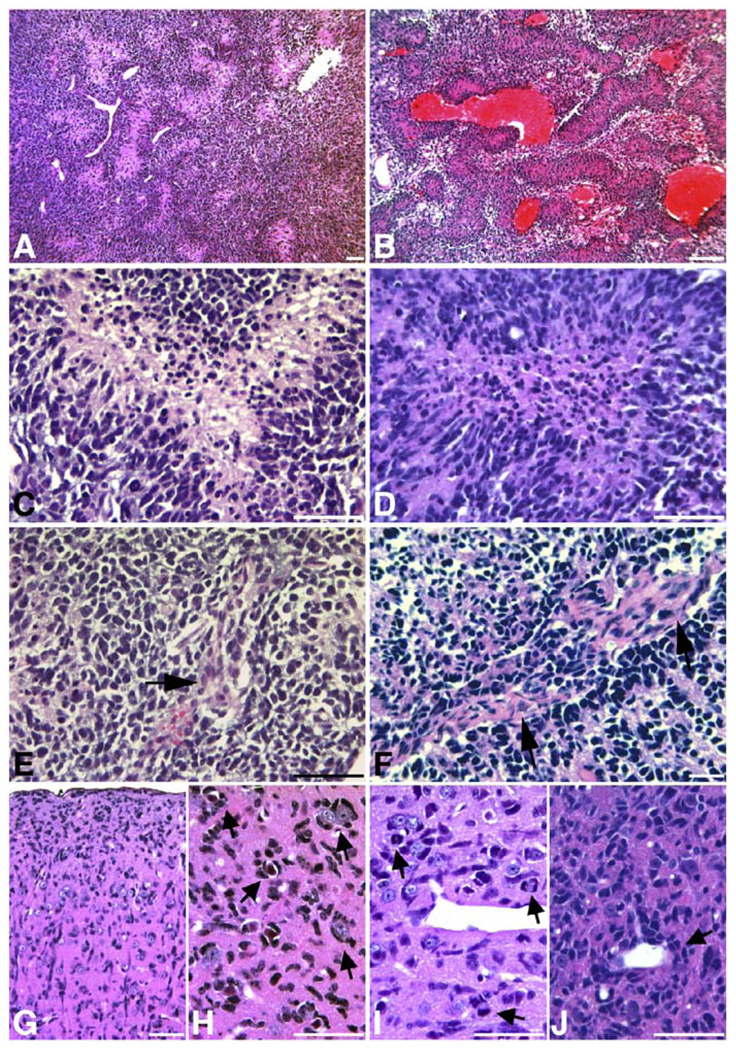
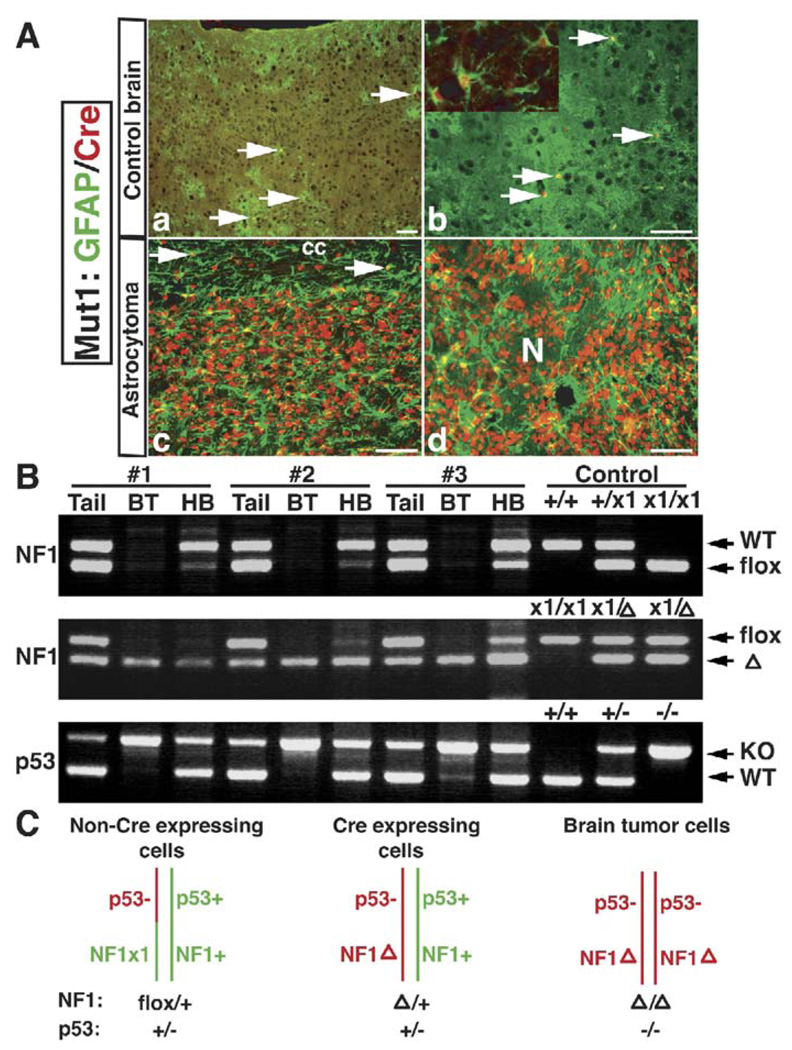
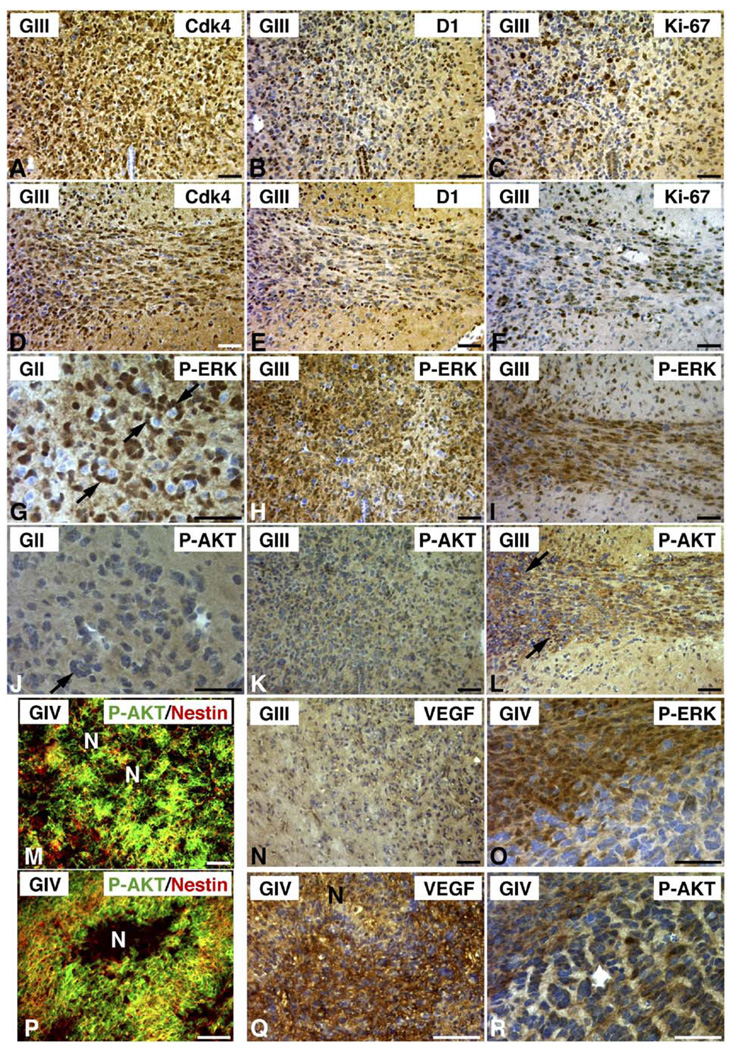
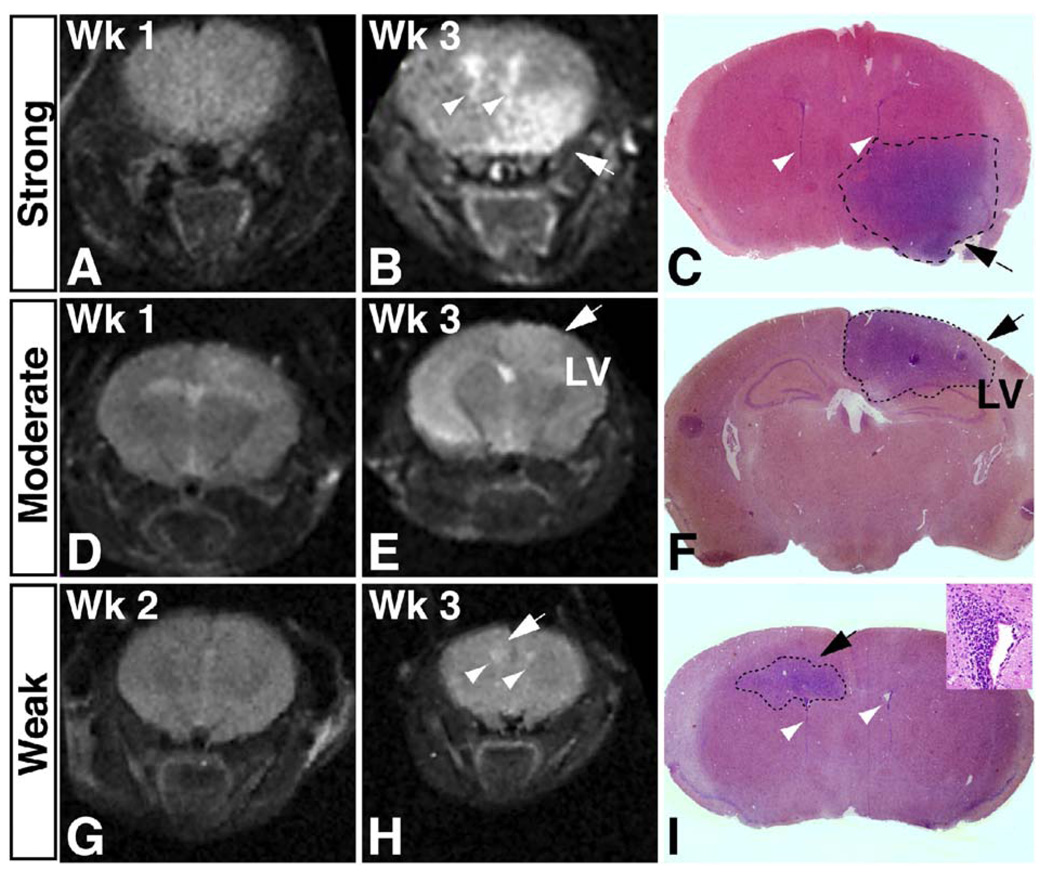
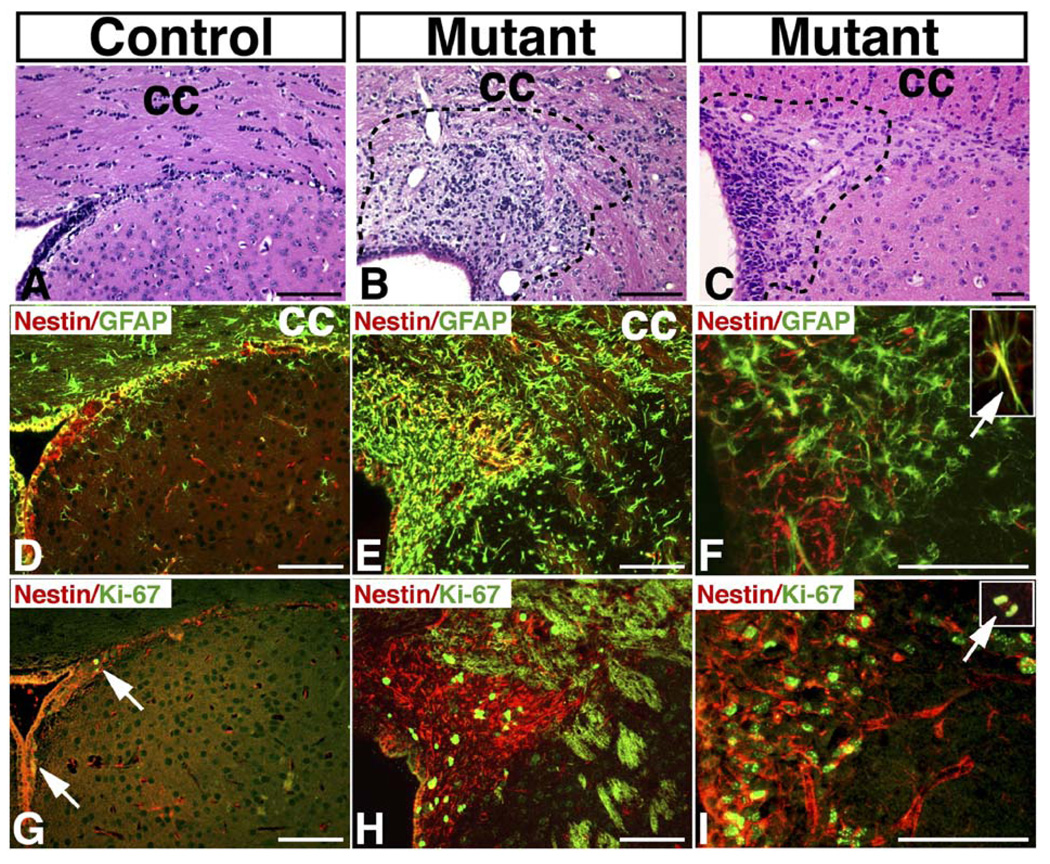
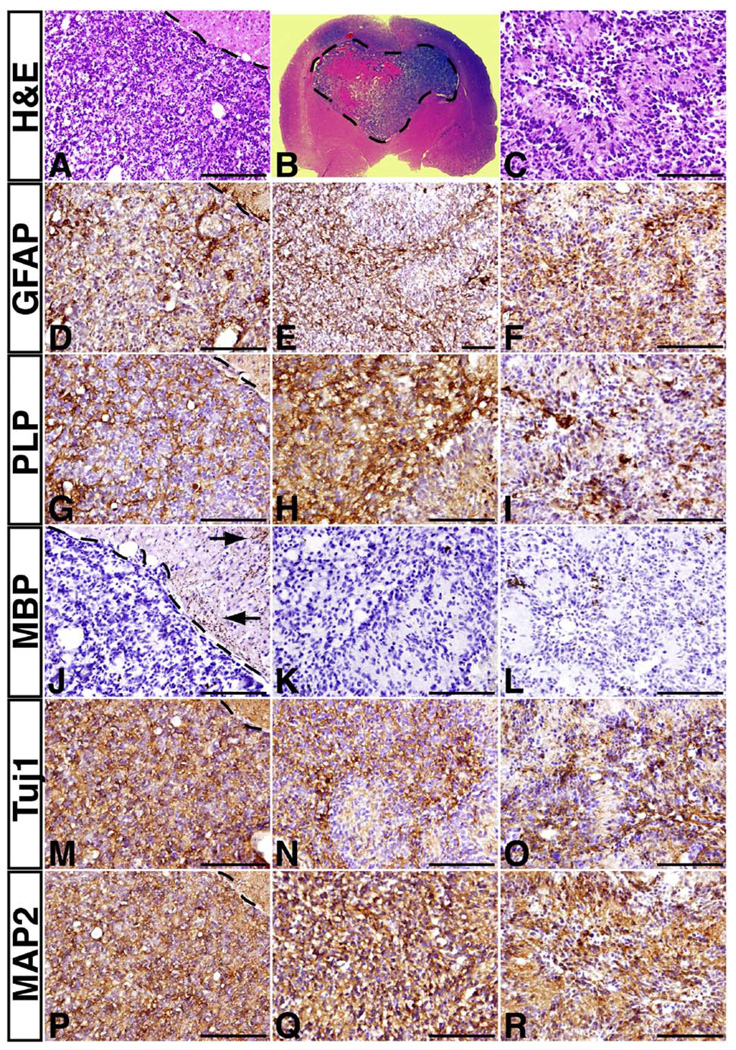
Malignant astrocytoma, the most prevalent primary brain tumor, is resistant to all known therapies and frequently harbors mutations that inactivate p53 and activate Ras signaling. We have generated mouse strains that lack p53 and harbor a conditional allele of the NF1 tumor suppressor that negatively regulates Ras signaling. The mice develop malignant astrocytomas with complete penetrance. The majority of tumors display characteristics of glioblastoma multiforme with concomitant alteration of signaling pathways previously described in the human counterparts of this neoplasm. We find that the sequence of tumor suppressor inactivation influences tumorigenicity and that earliest evidence of tumor formation localizes to regions of the brain that contain a multipotent stem cell population capable of in vivo differentiation into neurons and glia.


Figures

Figure 1
Figure 1. Schematic drawing of the genetic configurations of Mut1–3 mice
The green color is used to label the normal alleles, including the wild-type allele (+) and the floxed allele (×1); the red color is used to label the null alleles, including the recombined floxed allele (Δ) and the knockout allele (−). Genotypes for each cell type are indicated in parentheses.
Figure 2
Figure 2. Mut1 mice develop a full spectrum of malignant astrocytoma
Sections from grade II, grade III, and grade IV astrocytomas of Mut1 brains were stained with hematoxylin and eosin (H&E) (A–C), an anti-GFAP antibody (D–F), and an anti-nestin antibody (G–I). Arrows in A point to abnormal tumor cells surrounding neurons (perineuronal satellitosis); arrows in B and C point to multinucleated giant cells; and arrows in E and F indicate reactive astrocytes. J: Survival curves of Mut1, Mut2, Mut3, and p53 null (p53−/−) mice. The following numbers of mice were used for each group of mutant mice: Mut1, n = 14; Mut2, n = 21; Mut3, n = 58; p53−/−, n = 20. The incidence of non-CNS tumors observed in Mut1–3 mice is as follows: Mut1, 9/14; Mut2, 4/21; and Mut3, 11/ 58. K: The graph shows astrocytoma frequency and grade observed in end-stage Mut1 mice (n = 14), asymptomatic Mut1* mice (n = 12; 6 to 10 weeks of age), end-stage Mut2 mice (n = 18), end-stage Mut3 mice (n = 21), and asymptomatic Mut3* mice (n = 3; 18 weeks of age). “N,” necrosis. Scale bar, 50 µm.
Figure 3
Figure 3. Histological hallmarks of GBM in Mut3 brains
Brain sections from the Mut3 brains were stained with H&E. GBMs from two independent Mut3 brains were characterized by the presence of multifocal pseudopalisading tumor cells (A and B), necrosis (C and D), microvascular proliferation (arrows in E and F), and secondary structures of Scherer, including accumulation of tumor cells in the subpial zone of the cerebral cortex (G), perineuronal satellitosis characterized by tumor cells surrounding neurons (arrows in H), and perivascular satellitosis characterized by tumor cells surrounding blood vessels (arrow in J). Arrows in I indicate mitotic figures amid the tumor cells. Scale bar, 50 µm.
Figure 4
Figure 4. Inactivation of p53 and NF1 tumor suppressors in Mut1 and Mut3 astrocytomas
A: Sections from normal cerebral cortex (Aa and Ab), a grade III astrocytoma (Ac), and a GBM (Ad) of Mut1 brains were subjected to double-labeling immunofluorescence with anti-GFAP (green) and anti-Cre (red). In the normal adult brain, every Cre-positive astrocyte also expressed GFAP (arrows in Aa and Ab), indicating the specificity of the human GFAP promoter. The inset in Ab shows the morphology of the Cre-expressing GFAP-positive astrocytes. In astrocytomas and GBMs, every tumor cell expressed Cre recombinase indicative of NF1 deficiency in the Mut1 strain (Ac and Ad). Notably, a significant number of tumor cells downregulate GFAP expression in GBM (Ad). Arrows in Ac point to normal astrocytes adjacent to tumor tissues expressing both Cre and GFAP. CC, corpus callosum; N, necrosis. Scale bar, 50 µm. B: Genomic DNAs isolated from tail tissues, brain tumors (BT), and hindbrain (HB) of three independent Mut3 mice (#1–#3) were subjected to PCR-based assays for genotyping the NF1 and p53 gene. Upper panel: a PCR assay that identifies the wild-type (WT) and the floxed (flox) NF1 allele showed that the tail tissues of the Mut3 mice contained one wild-type NF1 allele and one floxed NF1 allele; Cre-expressing tissues (e.g., hindbrain) retained the wild-type NF1 allele but lost most of the floxed allele as a result of Cre-mediated recombination; and brain tumors lost both the wild-type and the floxed NF1 alleles indicative of NF1 deficiency. Middle panel: a PCR assay identifying the floxed NF1 allele and recombined floxed allele (Δ) confirmed that the floxed NF1 allele in both hindbrain and brain tumors transformed into the recombined allele. Of note, a subpopulation of cells in tail tissues underwent recombination as well. Bottom panel: PCR assay identifying the wild-type and the null allele (KO) of the p53 gene showing that tail tissues and hindbrain of Mut3 mice are heterozygous for the p53 gene, while brain tumors lost the wild-type p53 allele. C: Schematic drawing of allelic loss of NF1 and p53 in astrocytoma formation as described in B. The green color is used to label the normal alleles, including the wild-type allele (+) and the floxed allele (flox); the red color is used to label the null alleles, including the recombined floxed allele (Δ) and the knockout allele (−).
Figure 5
Figure 5. Molecular analysis of high-grade astrocytomas and GBMs
Adjacent sections from two grade III astrocytomas (GIII) were stained with anti-Cdk4 (A and D), anti-cyclin D1 (B and E), and a marker of proliferation, anti-Ki-67, to identify proliferating cells (C and F). In contrast to normal CNS cells that have little Cdk4 and cyclin D1 expression, high-grade tumors showed strong nuclear staining of Cdk4 and cyclin D1. Adjacent sections from a low-grade astrocytoma (GII) (G and J) and two grade III astrocytomas (GIII) (H and K; I and L) were stained with anti-phospho-erk (P-ERK) and anti-phospho-AKT (P-AKT), respectively. Arrows in G and J point to abnormal tumor cells surrounding neurons; arrows in L indicate P-AKT-positive tumor cells. Sections from a GBM were subjected to double-labeling immunofluorescence with anti-P-AKT (green) and anti-nestin (red) (M and P). “N,” necrosis. Sections from a grade III astrocytoma (N) and a GBM (Q) were stained with anti-VEGF. Adjacent sections from a GBM were stained with anti-P-ERK (O) and anti-P-AKT (R). Scale bar, 50 µm.
Figure 6
Figure 6. In vivo growth pattern of astrocytomas on the MRI scan
A cohort of asymptomatic Mut1 mice was subjected to MRI scan once a week over a 3 week period. Representative T2-weighted images of three Mut1 mice were scanned by MRI at week 1 (Wk1) (A and D), week 2 (G), and week 3 (Wk3) (B, E, and H). Following MRI, mice were subjected to histological analysis. Sections at similar levels of MRI images (B, E, and H) were stained with H&E (C, F, and I). No overt lesions were identified on the images scanned at early weeks (A, D, and G). Hyperintense T2 signals ranging from strong to moderate to weak were identified on the images at week 3 (B, E, and H). Arrows point to tumors, and arrowheads indicate the SVZ. The dashed lines in C, F, and I mark the tumor margin. The inset in I shows the abnormal tumor cells associated with the SVZ. LV, lateral ventricle.
Figure 7
Figure 7. Astrocytomas are confined to the sub-ventricular zone of the lateral ventricle
Adjacent sections from the SVZ of a control and two mutant brains were stained with H&E (A–C) and immunofluorescence by anti-nestin (red)/anti-GFAP (green) (D–F) and anti-nestin (red)/anti-Ki-67 (green) (G–I). Of note, mutant brains had nascent tumors associated with the SVZ. The tumor margin is marked by the dashed lines (B and C). The inset in F (arrow) shows a nestin/GFAP double-positive reactive astrocyte, and the inset in I (arrow) shows a nestin/Ki-67 double-positive (arrow) cell undergoing mitosis. CC, corpus callosum. Scale bar, 100 µm.
Figure 8
Figure 8. GBM cells have the stem cell capacity to undergo multilineage differentiation in vivo
A–C: Sections from three representative GBMs that contained pure noninfiltrative tumor tissues were stained with H&E. The dashed lines in A and B mark the border between the main tumor mass and surrounding brain tissues. Adjacent sections of AC were stained with anti-GFAP (D–F), anti-PLP (G–I), anti-MBP (J–L), anti-Tuj1 (M–O), and MAP2 (P–R). Of note, in contrast to normal brain that contains extensive MBP staining (arrows in J), minimal or no staining was detected in these pure noninfiltrative tumor tissues (J–L). Scale bar, 100 µm.

Similar articles

Cited by

References

    1. Alvarez-Buylla A, Garcia-Verdugo JM, Tramontin AD. A unified hypothesis on the lineage of neural stem cells. Nat. Rev. Neurosci. 2001;2:287–293. - PubMed
    1. Bachoo RM, Maher EA, Ligon KL, Sharpless NE, Chan SS, You MJ, Tang Y, DeFrances J, Stover E, Weissleder R, et al. Epidermal growth factor receptor and Ink4a/Arf: convergent mechanisms governing terminal differentiation and transformation along the neural stem cell to astrocyte axis. Cancer Cell. 2002;1:269–277. - PubMed
    1. Bajenaru ML, Zhu Y, Hedrick NM, Donahoe J, Parada LF, Gutmann DH. Astrocyte-specific inactivation of the neurofibromatosis 1 gene (NF1) is insufficient for astrocytoma formation. Mol. Cell. Biol. 2002;22:5100–5113. - PMC - PubMed
    1. Cichowski K, Jacks T. NF1 tumor suppressor gene function: narrowing the GAP. Cell. 2001;104:593–604. - PubMed
    1. Cichowski K, Shih TS, Schmitt E, Santiago S, Reilly K, McLaughlin ME, Bronson RT, Jacks T. Mouse models of tumor development in neurofibromatosis type 1. Science. 1999;286:2172–2176. - PubMed

Publication types